Can someone me? !
the table shows the rainfall, in inches, in the month of july for t...

Mathematics, 05.01.2020 05:31 ballin4534
Can someone me? !
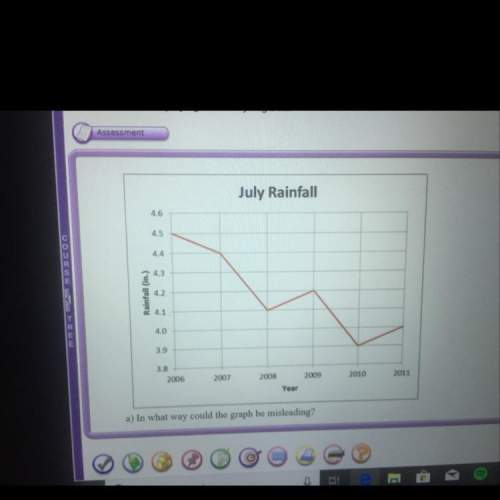
the table shows the rainfall, in inches, in the month of july for the years 2006-2011
2006=4.5
2007=4.4
2008=4.1
2009=4.2
2010=3.9
2011=4.0
alex used the graph below
(graph at the top)
a) in what way could this graph be misleading
b) how could you redraw the graph so that it is less misleading

Answers: 3


Another question on Mathematics
Mathematics, 21.06.2019 17:30
Can someone me with this problem i don't understand i need
Answers: 2
Mathematics, 21.06.2019 19:30
In the geometric progression –3, 12, −48… what term is 3,072?
Answers: 2
Mathematics, 21.06.2019 21:00
Describe how making an ‘and’ compound sentence effects your solution set
Answers: 1
Mathematics, 21.06.2019 23:20
Identify the function that contains the data in the following table: x -2 0 2 3 5 f(x) 5 3 1 2 4 possible answers: f(x) = |x| + 1 f(x) = |x - 2| f(x) = |x - 2| - 1 f(x) = |x - 2| + 1
Answers: 1
You know the right answer?
Questions

Computers and Technology, 21.10.2020 19:01


Spanish, 21.10.2020 19:01

Physics, 21.10.2020 19:01

Arts, 21.10.2020 19:01

History, 21.10.2020 19:01


Chemistry, 21.10.2020 19:01
Mathematics, 21.10.2020 19:01
History, 21.10.2020 19:01
Mathematics, 21.10.2020 19:01
Chemistry, 21.10.2020 19:01


