
Mathematics, 14.01.2020 09:31 kaleyf96
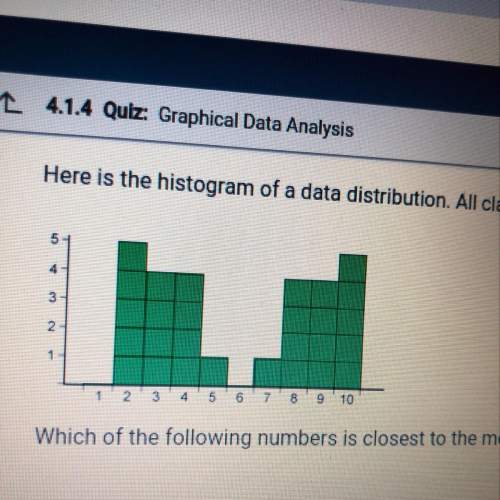
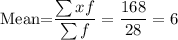
Here is the histogram of a data distribution. all class widths are 1. which of the following numbers is closest to the mean of this distribution?
a. 6
b. 9
c. 4
d. 3
e. 5

Answers: 1


Another question on Mathematics
Mathematics, 21.06.2019 21:00
How many kilograms of a 5% salt solution and how many kilograms of a 15% salt solution must be mixed together to make 45kg of an 8% salt solution?
Answers: 3
Mathematics, 21.06.2019 21:30
In triangle △abc, ∠abc=90°, bh is an altitude. find the missing lengths. ah=4 and hc=1, find bh.
Answers: 2
Mathematics, 22.06.2019 02:30
Acable company claims that the average household pays $78 a month for a basic cable plan, but it could differ by as much as $20. write an absolute value inequality to determine the range of basic cable plan costs with this cable company. a. |x − 78| ≥ 20 b. |x − 20| ≥ 78 c. |x − 20| ≤ 78 d. |x − 78| ≤ 20
Answers: 1
Mathematics, 22.06.2019 02:30
Select the correct statement about the function represented by the table
Answers: 2
You know the right answer?
Here is the histogram of a data distribution. all class widths are 1. which of the following numbers...
Questions


Mathematics, 20.11.2021 07:20

Mathematics, 20.11.2021 07:30

Chemistry, 20.11.2021 07:30

Computers and Technology, 20.11.2021 07:30

Social Studies, 20.11.2021 07:30
English, 20.11.2021 07:30
English, 20.11.2021 07:30

Mathematics, 20.11.2021 07:30
Mathematics, 20.11.2021 07:30


