
Mathematics, 01.01.2020 11:31 maddiiie128
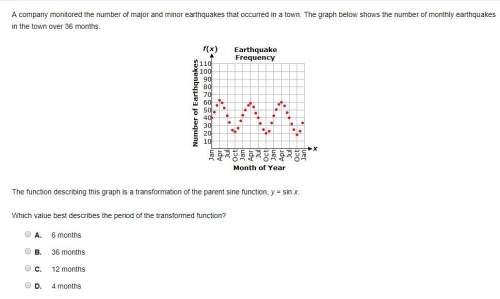
Acompany monitored the number of major and minor earthquakes that occurred in a town. the graph below shows the number of monthly earthquakes in the town over 36 months.
the function describing this graph is a transformation of the parent sine function, y = sin x.
which value best describes the period of the transformed function?

Answers: 2


Another question on Mathematics
Mathematics, 21.06.2019 14:00
Tiara buys the pizza shown below: a circular pizza is shown. the edge of one slice is marked ab. what does the curve ab represent?
Answers: 1
Mathematics, 21.06.2019 16:30
Hi my sisters and brothers can tell me the answer because i don’t understand the question
Answers: 1
You know the right answer?
Acompany monitored the number of major and minor earthquakes that occurred in a town. the graph belo...
Questions
Mathematics, 19.09.2019 16:30


English, 19.09.2019 16:30

History, 19.09.2019 16:30

Social Studies, 19.09.2019 16:30
History, 19.09.2019 16:30
English, 19.09.2019 16:30

Physics, 19.09.2019 16:30
History, 19.09.2019 16:30


Mathematics, 19.09.2019 16:30
Chemistry, 19.09.2019 16:30


