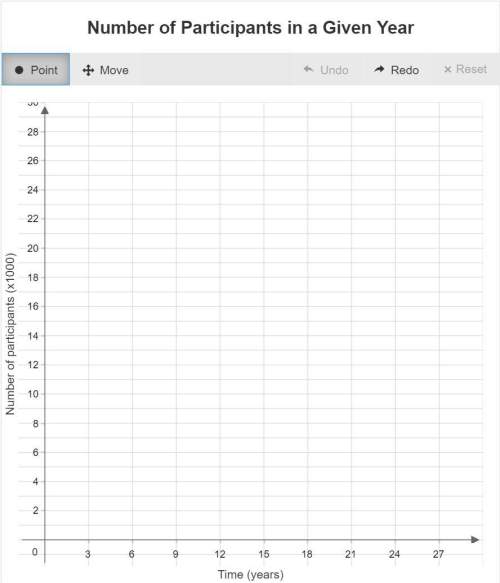
Use the data to create a scatter plot.
time (years) number of participants (x1000)
...

Mathematics, 28.12.2019 06:31 frisha
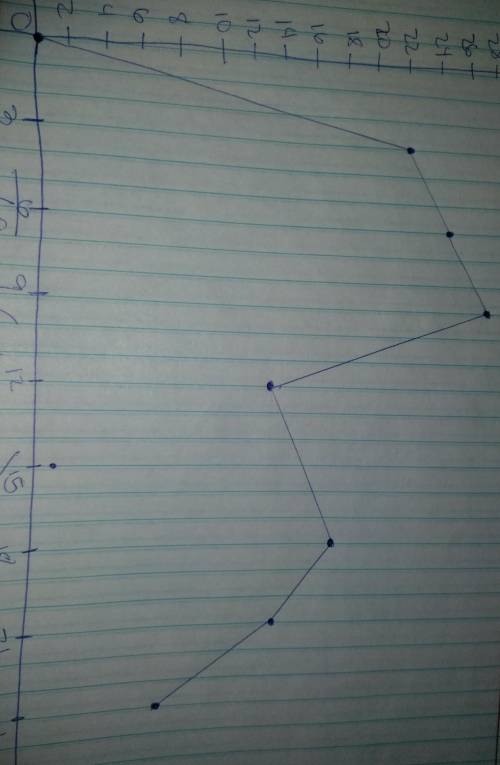
Use the data to create a scatter plot.
time (years) number of participants (x1000)
3 22
6 25
9 28
12 14
15 1
18 20
21 15
24 9

Answers: 3


Another question on Mathematics
Mathematics, 21.06.2019 18:00
In the xy-plane, if the parabola with equation passes through the point (-1, -1), which of the following must be true?
Answers: 3
Mathematics, 21.06.2019 18:10
What is the equation in slope-intercept form of the linear function represented by the table? y -18 -1 -8 4 2 912 o y=-2x-6 o y=-2x+6 o y=2x-6 o y = 2x+6
Answers: 1
Mathematics, 21.06.2019 18:30
Identify the polynomial. a2b - cd3 a.monomial b.binomial c.trinomial d.four-term polynomial e.five-term polynomial
Answers: 1
Mathematics, 21.06.2019 19:30
Hi, can anyone show me how to do this problem? 100 points for this. in advance
Answers: 2
You know the right answer?
Questions
Mathematics, 25.06.2020 02:01
Mathematics, 25.06.2020 02:01
Mathematics, 25.06.2020 02:01
Mathematics, 25.06.2020 02:01


History, 25.06.2020 02:01


