
Mathematics, 07.10.2019 19:50 douglife8057
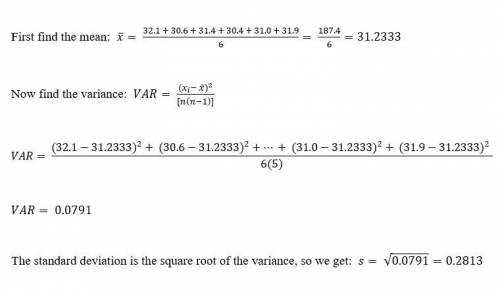
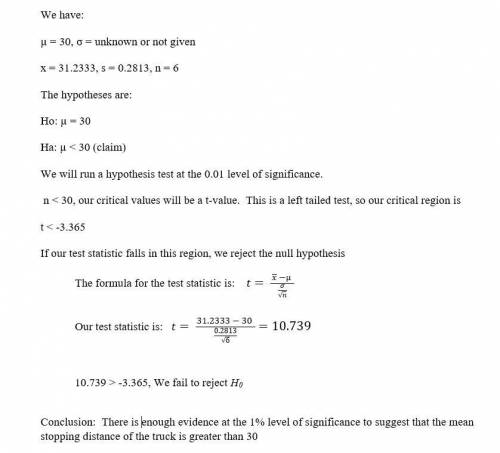
The following observations are on stopping distance (ft) of a particular truck at 20 mph under specified experimental conditions (“experimental measurement of the stopping performance of a tractor-semitrailer from multiple speeds,” nhtsa, dot hs 811 488, june 2011): 32.1 30.6 31.4 30.4 31.0 31.9 the cited report states that under these conditions, the maximum allowable stopping distance is 30. a normal probability plot validates the assumption that stopping distance is normally distributed. a. does the data suggest that true average stopping distance exceeds this maximum value? test the appropriate hypotheses using a 5 .01.

Answers: 1


Another question on Mathematics
Mathematics, 21.06.2019 16:00
Which rational number could be graphed between -4 and -5
Answers: 1
Mathematics, 21.06.2019 23:00
Calculate the average rate of change over the interval [1, 3] for the following function. f(x)=4(5)^x a. -260 b. 260 c. 240 d. -240
Answers: 1
Mathematics, 21.06.2019 23:00
Someone answer this asap for the function f(x) and g(x) are both quadratic functions. f(x) = x² + 2x + 5 g(x) = x² + 2x - 1 which statement best describes the graph of g(x) compared to the graph of f(x)? a. the graph of g(x) is the graph of f(x) shifted down 1 units. b. the graph of g(x) is the graph of f(x) shifted down 6 units. c. the graph of g(x) is the graph of f(x) shifted to the right 1 unit. d. the graph of g(x) is the graph of f(x) shifted tothe right 6 units.
Answers: 3
Mathematics, 21.06.2019 23:00
Rob filled 5 fewer plastic boxes with football cards than basketball cards. he filled 11 boxes with basketball cards.
Answers: 1
You know the right answer?
The following observations are on stopping distance (ft) of a particular truck at 20 mph under speci...
Questions


