
Mathematics, 21.09.2019 16:30 eduardo60
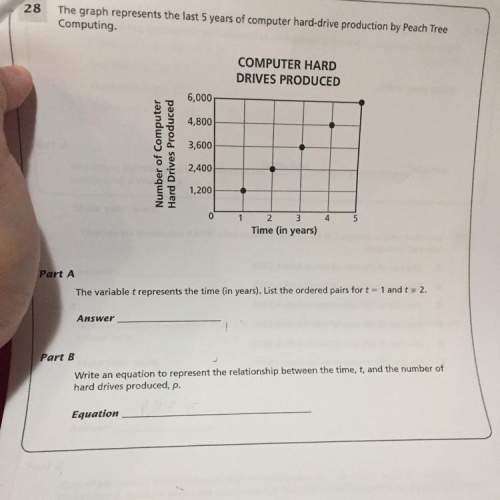
The graph represents the last 5 years of computer hard-drive production by peach tree computing
part a: the variable t represents the time (in years).list the ordered pairs for t=1 and t=2.
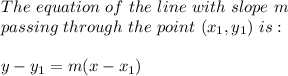
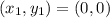
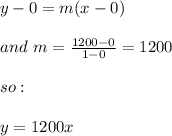
part b: write an equation to represent the relationship between the time, t, and the number of hard drives produced, p.

Answers: 1
 represents the time (in years), so we need to list the ordered pairs for
  . An ordered pair are two numbers written in a certain order usually in parentheses like
  . Here in this problem
  will represent the time
  will represent the Number of Computer Hard Drive Produced
  , thus:
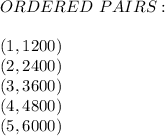


Another question on Mathematics
Mathematics, 22.06.2019 01:40
Manuela solved the equation below. what is the solution to manuela’s equation?
Answers: 2
Mathematics, 22.06.2019 04:30
Ef is a median of trapezoid abcd. the length of ab is 12, and the length of cd is 18. the length of bf is 4. what is the length of fc?
Answers: 2
Mathematics, 22.06.2019 04:30
The westins and the shermans live in the same city and pay the same sales tax rate, and both families made $14,000 in taxable purchases last year. if the westins made $86,000 and the shermans made $33,000 last year, is the sales tax in their city an example of a regressive tax? yes, because the westins and the shermans both paid the same sales tax rate. b. no, because the shermans paid a higher percentage of their income in sales tax than the westins did. c. no, because the westins and the shermans both paid the same sales tax rate. d. yes, because the shermans paid a higher percentage of their income in sales tax than the westins did.
Answers: 1
You know the right answer?
The graph represents the last 5 years of computer hard-drive production by peach tree computing
Questions

World Languages, 18.05.2021 14:50

Physics, 18.05.2021 14:50

Mathematics, 18.05.2021 14:50

Chemistry, 18.05.2021 14:50
Mathematics, 18.05.2021 14:50

Mathematics, 18.05.2021 14:50
Mathematics, 18.05.2021 14:50
Mathematics, 18.05.2021 14:50

Biology, 18.05.2021 14:50

English, 18.05.2021 14:50


