Mathematics, 14.10.2019 15:30 19youngr
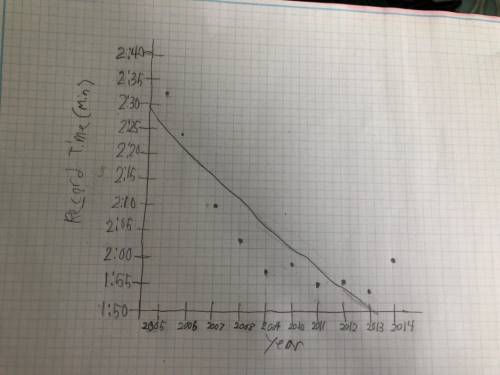
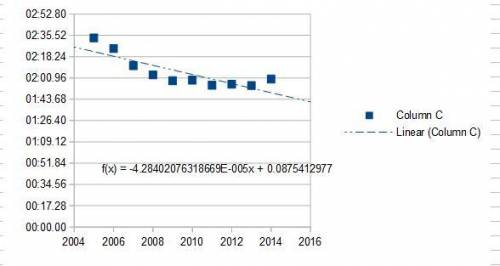
An olympic swimmer competes in the same events during each long course swim season. a swimmer currently competing on the united states women’s olympic swim team, will swim her best events each year with the hope of continuous improvement. the following table is a record of the swimmer’s best times for the 100 meter freestyle event, measured in long course meters.
long course
season recorded
best time
2005 2: 33.42
2006 2: 24.81
2007 2: 10.93
2008 2: 03.45
2009 1: 58.67
2010 1: 59.17
2011 1: 55.06
2012 1: 55.82
2013 1: 54.81
2014 2: 00.03
create a scatter plot representing the data displayed in the table.
use the scatter plot to determine whether there is positive, negative or no correlation between the data values.
write a conclusion statement regarding the data and the rate of change present in the line of best fit. do not actually calculate the slope or write the equation for the line of best fit.

Answers: 3


Another question on Mathematics

Mathematics, 21.06.2019 17:00
Igor stravinsky tires sells approximately 3,760,000 car tires and 1,200,000 truck tires each year. about 47,000,000 care tires and 26,000,00 truck tires are sold each year in the united states. what is stravinsky's market share in each of these two markets (cars and trucks)?
Answers: 1

Mathematics, 21.06.2019 21:30
Data from 2005 for various age groups show that for each $100 increase in the median weekly income for whites, the median weekly income of blacks increases by $105. also, for workers of ages 25 to 54 the median weekly income for whites was $676 and for blacks was $527. (a) let w represent the median weekly income for whites and b the median weekly income for blacks, and write the equation of the line that gives b as a linear function of w. b = (b) when the median weekly income for whites is $760, what does the equation in (a) predict for the median weekly income for blacks?
Answers: 2

Mathematics, 21.06.2019 22:00
Write a description of each inequality. 1. -5a + 3 > 1 2. 27 - 2b < -6 (this < has a _ under it) 3. 1/2 (c + 1) > 5 (this > has a _ under it)
Answers: 3

Mathematics, 21.06.2019 22:00
Match the scale and the actual area to the area of the corresponding scale drawing. scale: 1 inch to 4 feet actual area: 128 square feet scale: 1 inch to 7 feet actual area: 147 square feet scale: 1 inch to 8 feet actual area: 256 square feet scale: 1 inch to 5 feet actual area: 225 square feet area of scale drawing scale and actual area scale drawing area: 3 square inches arrowright scale drawing area: 8 square inches arrowright scale drawing area: 4 square inches arrowright scale drawing area: 9 square inches arrowright
Answers: 2
You know the right answer?
An olympic swimmer competes in the same events during each long course swim season. a swimmer curren...
Questions

English, 26.10.2020 20:40

Biology, 26.10.2020 20:40

Health, 26.10.2020 20:40

Mathematics, 26.10.2020 20:40


Mathematics, 26.10.2020 20:40

Mathematics, 26.10.2020 20:40


History, 26.10.2020 20:40

Mathematics, 26.10.2020 20:40

Mathematics, 26.10.2020 20:40


History, 26.10.2020 20:40


Mathematics, 26.10.2020 20:40


Biology, 26.10.2020 20:40

Chemistry, 26.10.2020 20:40

History, 26.10.2020 20:40


