Mathematics, 16.12.2019 07:31 isabellemaine
Chelsea has an electronics business. during her first year she collected data on different prices that yield different profits. she came up with the following graph showing the relationship between the selling price of a item and the quantity sold. based off the graph what do the two black circles represents. the choices are " the selling prices that produce no profit, the selling prices that provide the maximum yearly profit, and the selling price that produces $12,000 in profit. answer this is graded on accuracy

Answers: 3


Another question on Mathematics

Mathematics, 21.06.2019 17:00
When only separate discreet points are graphed it is called?
Answers: 1

Mathematics, 21.06.2019 17:50
Eric has challenged himself to walk 24,000 steps in 4 days. if eric walks the same number of steps each day, which function represents the number of steps eric still needs to walk to reach his goal with respect to the number of days since he started his challenge? a. y = 8,000x − 24,000 b. y = -8,000x + 24,000 c. y = 6,000x − 24,000 d. y = -6,000x + 24,000
Answers: 1

Mathematics, 21.06.2019 18:30
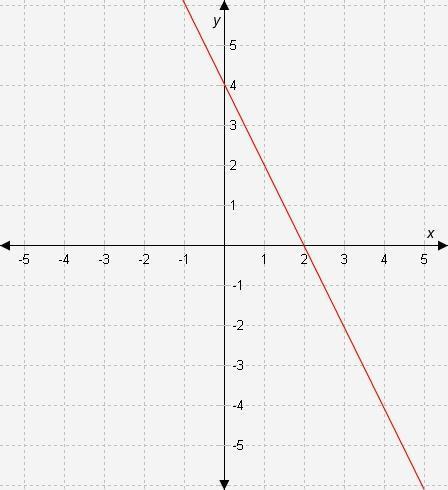
Which representation has a constant of variation of -2.5
Answers: 1

Mathematics, 21.06.2019 19:00
Graph g(x)=2cosx . use 3.14 for π . use the sine tool to graph the function. graph the function by plotting two points. the first point must be on the midline and closest to the origin. the second point must be a maximum or minimum value on the graph closest to the first point.
Answers: 1
You know the right answer?
Chelsea has an electronics business. during her first year she collected data on different prices th...
Questions

Mathematics, 14.12.2020 23:30


Mathematics, 14.12.2020 23:30


Computers and Technology, 14.12.2020 23:30


Mathematics, 14.12.2020 23:30

English, 14.12.2020 23:30

History, 14.12.2020 23:30


Mathematics, 14.12.2020 23:30

Mathematics, 14.12.2020 23:30


Mathematics, 14.12.2020 23:30

Mathematics, 14.12.2020 23:30


