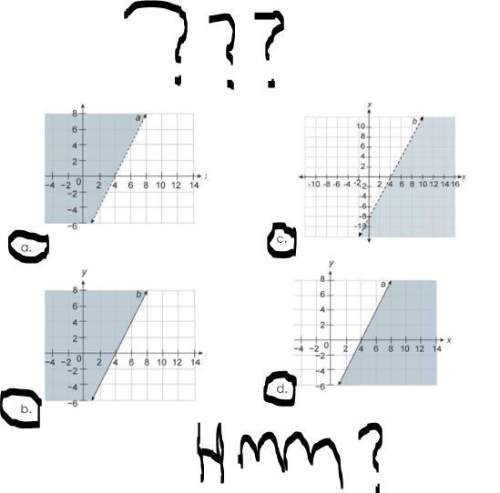
What graph best represents the solution to the inequality
y−2x> −8
...

Mathematics, 04.12.2019 15:31 jalenshayewilliams
What graph best represents the solution to the inequality
y−2x> −8

Answers: 2


Another question on Mathematics
Mathematics, 21.06.2019 13:30
Which of the fallowing best completes the sequence 12,8,5, a) 1 b) 2 c)4 d)0
Answers: 2
Mathematics, 21.06.2019 14:00
Assume that a population of 50 individuals has the following numbers of genotypes for a gene with two alleles, b and b: bb = 30, bb = 10, and bb = 10. calculate the frequencies of the two alleles in the population’s gene pool.
Answers: 2
Mathematics, 21.06.2019 15:00
Select the correct answer from each drop-down menu. rewrite the formula to find voltage. the formula for electrical power (p, in watts) is where v is the voltage in volts and r is the resistance in ohms. for a particular brand of water heater, r is 32 ohms and p is 0.5 watts. the formula to find v is , and the voltage at which the heater operates is volts.
Answers: 1
Mathematics, 21.06.2019 19:00
Eis the midpoint of line segment ac and bd also line segment ed is congruent to ec prove that line segment ae is congruent to line segment be
Answers: 3
You know the right answer?
Questions
Mathematics, 05.11.2020 18:30

Social Studies, 05.11.2020 18:30


Business, 05.11.2020 18:30

Computers and Technology, 05.11.2020 18:30
Mathematics, 05.11.2020 18:30


English, 05.11.2020 18:30
Mathematics, 05.11.2020 18:30


