
Mathematics, 25.10.2019 09:43 estefanlionel8678
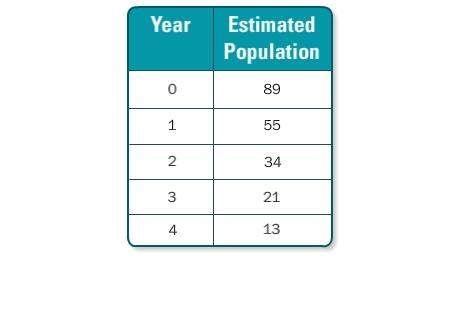
The table shows the estimated number of deer living in a forest over a five-year period. are the data best represented by a linear, exponential, or quadratic model? write an equation to model the data.
0/89 1/55 2/34 3/21 4/13
a. quadratic; y = 0.62x2 + 89
b. exponential; y = 89 • 0.62x
c. linear; y = 0.62x + 89
d. quadratic; y = 89x2 + 0.62

Answers: 1
 = 0.618
 = 0.618


Another question on Mathematics
Mathematics, 21.06.2019 14:30
The perimiter of a rectangle is 70 inches the legneth of the rectangle is 5 less than 3 times the width of the rectangle what is the width of the rectangle
Answers: 3
Mathematics, 21.06.2019 18:30
Barbara deposited $300 in the bank. if the bank pays her simple interest at the rate of 4 percent per year, how much money will she have in her account at the end of 9 months?
Answers: 1
Mathematics, 21.06.2019 20:40
The roots of the function f(x) = x2 – 2x – 3 are shown. what is the missing number?
Answers: 2
You know the right answer?
The table shows the estimated number of deer living in a forest over a five-year period. are the dat...
Questions


Chemistry, 26.10.2021 15:10

SAT, 26.10.2021 15:10


Arts, 26.10.2021 15:10

Mathematics, 26.10.2021 15:10
Mathematics, 26.10.2021 15:10
Mathematics, 26.10.2021 15:10

History, 26.10.2021 15:10
SAT, 26.10.2021 15:10
Engineering, 26.10.2021 15:10
Health, 26.10.2021 15:10


