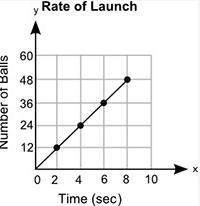
The graph shows the number of paintballs a machine launches, y, in x seconds:
a graph t...

Mathematics, 19.11.2019 00:31 kyliefetters11
The graph shows the number of paintballs a machine launches, y, in x seconds:
a graph titled rate of launch is shown. the x axis label is time in seconds, and the x axis values are from 0 to 10 in increments of 2 for each grid line. the y axis label is number of balls, and the y axis values from 0 to 60 in increments of 12 for each grid line. a line is shown connecting points on ordered pair 2, 12 and 4, 24 and 6, 36 and 8, 48.
which expression can be used to calculate the rate per second at which the machine launches the balls?
a.) 2/12
b.) 12/2
c.) 2/48
d.) 48/2


Answers: 2


Another question on Mathematics

Mathematics, 22.06.2019 00:40
Calculate the effective quarterly compound interest rate equivalent to a 1% of monthly compound interest rate.
Answers: 3

Mathematics, 22.06.2019 02:00
Will make ! for correct answer the dot plot below shows the number of toys 21 shops sold in an hour.is the median or the mean a better center for this data and why? a. median; because the data is not symmetric and there are outliersb. median; because the data is symmetric and there are no outliersc. mean; because the data is symmetric and there are no outliersd. mean; because the data is skewed and there are outliers
Answers: 2

Mathematics, 22.06.2019 03:00
Let us imagine that the number of automobile accidents in a certain region are related to the regional number of registered automobiles in tens of thousands (b1), alcoholic beverage sales in $10,000 (b2), and decrease in the price of gasoline in cents (b3). furthermore, imagine that the regression formula has been calculated as: y = a + b1x1 + b2x2 + b3x3 where y = the number of automobile accidents, a = 7.5, b1 = 3.5, b2 = 4.5, and b3 = 2.5 calculate the expected number of automobile accidents for a football weekend if the region has 25,000 registered vehicles, $75,000 worth of beer is sold, and a gas war causes a 10 cent drop in a gallon of gas.
Answers: 3

Mathematics, 22.06.2019 03:20
Arepresentative from plan 1 wants to use the graph below to sell health plans for his company. how might the graph be redrawn to emphasize the difference between the cost per doctor visit for each of the three plans? the scale on the y-axis could be changed to 0–100. the scale on the y-axis could be changed to 25–40. the interval of the y-axis could be changed to count by 5s. the interval of the y-axis could be changed to count by 20s.
Answers: 2
You know the right answer?
Questions


Computers and Technology, 14.08.2020 02:01


Mathematics, 14.08.2020 02:01


English, 14.08.2020 02:01


