
The tables below show four sets of data:
set a
x 1 2 3 4 5 6 7 8 9
y 10...

Mathematics, 10.12.2019 17:31 lclaudettecarte8346
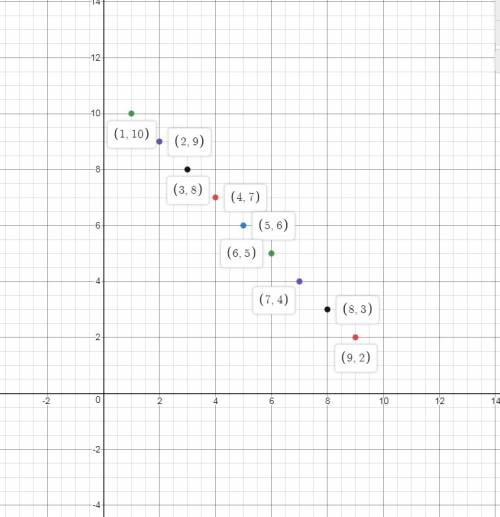
The tables below show four sets of data:
set a
x 1 2 3 4 5 6 7 8 9
y 10 9 8 7 6 5 4 3 2
set b
x 1 2 3 4 5 6 7 8 9
y 3 4 5 6 7 8 9 10 11
set c
x 1 2 3 4 5 6 7 8 9
y 8 6 5 4 3.5 3 2.5 2 2
set d
x 1 2 3 4 5 6 7 8 9
y 1 2.5 2.5 3 4 5 6 8 9
for which set of data will the scatter plot represent a negative linear association between x and y? (4 points)
set a
set b
set c
set d

Answers: 2


Another question on Mathematics
Mathematics, 21.06.2019 15:00
Δabc is reflected across line l to form δ alblcl, and a¯¯¯al¯¯¯¯ intersects line l at point d. which equation is not necessarily true?
Answers: 3
Mathematics, 21.06.2019 19:30
Geometry in the diagram, ∠abc is a right angle. ∠dbc = 30°27'40". find the measure of ∠abd.
Answers: 1
Mathematics, 22.06.2019 01:00
Luisa sells stuffed animals. she sells her stuffed elephant for $34.90, and the sales tax is 6% of the sale price. about how much is the sales tax on the elephant?
Answers: 2
You know the right answer?
Questions


Mathematics, 24.11.2021 14:30

Biology, 24.11.2021 14:30

Mathematics, 24.11.2021 14:30
Mathematics, 24.11.2021 14:30

Chemistry, 24.11.2021 14:30

Computers and Technology, 24.11.2021 14:30

Mathematics, 24.11.2021 14:40


