Mathematics, 30.06.2019 11:20 siriuskitwilson9408
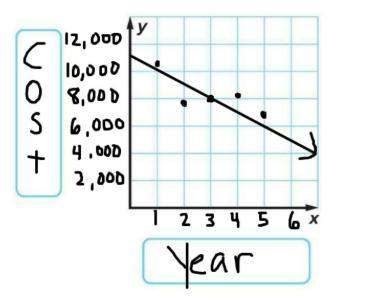
The table shows the average cost to own a certain car over a period of five years. year 1 2 3 4 5 cost ($) 10,600 7,900 8,000 8,100 7,000 take a look at the scatter plot of the data below and the line of best fit that was drawn. write an equation in slope-intercept form (y = mx + b) for the line of best fit and interpret the slope and y-intercept by stating what the slope and y-intercept are representing in this situation.


Answers: 1


Another question on Mathematics

Mathematics, 21.06.2019 19:00
The figures below are made out of circles, semicircles, quarter circles, and a square. find the area and the perimeter of each figure and give your answers as a completely simplified exact value in terms of π (no approximations).
Answers: 1

Mathematics, 21.06.2019 20:30
1. evaluate 8x(2)y9(-2) for x=-1 and y=2 2. simplify the equation. -() 3. simplify the expression. [tex]\frac{5}{x(-2) y9(5)}[/tex]
Answers: 1

Mathematics, 22.06.2019 00:30
Isaac wants the equation below to have no solution when the missing number is placed in the box. which number should he place in the box?
Answers: 2

Mathematics, 22.06.2019 06:50
Based on the calculations you did using the law of sines, did you make a good choice for which ladder to use? why or why not?
Answers: 3
You know the right answer?
The table shows the average cost to own a certain car over a period of five years. year 1 2 3 4 5 co...
Questions


History, 16.12.2021 23:50

Mathematics, 16.12.2021 23:50

Social Studies, 16.12.2021 23:50


Mathematics, 16.12.2021 23:50


Spanish, 16.12.2021 23:50

Computers and Technology, 16.12.2021 23:50


Advanced Placement (AP), 16.12.2021 23:50

English, 16.12.2021 23:50

Mathematics, 16.12.2021 23:50

Business, 16.12.2021 23:50

Mathematics, 16.12.2021 23:50


Mathematics, 16.12.2021 23:50


