
Mathematics, 27.06.2019 18:40 dozsyerra
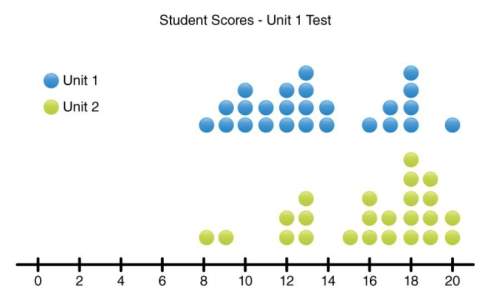
The following dot plot represents student scores on both the unit 1 and unit 2 math tests. scores are in whole number increments. part 1: looking at the data plots, which test do you think the students scored better on? do you think one of the tests has more variation than the other or is the variation about the same for both tests? use complete sentences in your answer and explain your reasoning. part 2: calculate the mean (rounded to the nearest whole number) and mean absolute deviation for the unit 1 test. part 3: do your results from part b prove or disprove your hypotheses from part a? use complete sentences in your answer and explain your reasoning.

Answers: 3


Another question on Mathematics
Mathematics, 21.06.2019 15:30
Given the box plot, will the mean or the median provide a better description of the center? box plot with min at 10.5, q1 at 11.5, median at 12.5, q3 at 13.5, max at 15
Answers: 2
Mathematics, 21.06.2019 21:30
Write 5(6x+4)-2(5x-2) in the form a(bx+c) where a,b and c integers and a> 1
Answers: 2
Mathematics, 21.06.2019 23:00
Acarton of juice contains 64 ounces miss wilson bought six cartons of juice how many ounces of juice did she buy
Answers: 2
You know the right answer?
The following dot plot represents student scores on both the unit 1 and unit 2 math tests. scores ar...
Questions

Health, 05.05.2020 13:06

Biology, 05.05.2020 13:06

English, 05.05.2020 13:06
English, 05.05.2020 13:06
Mathematics, 05.05.2020 13:06


Computers and Technology, 05.05.2020 13:06
Mathematics, 05.05.2020 13:06


History, 05.05.2020 13:06
English, 05.05.2020 13:06

Chemistry, 05.05.2020 13:06
Mathematics, 05.05.2020 13:06
History, 05.05.2020 13:06


