Mathematics, 26.06.2019 01:10 pssluke
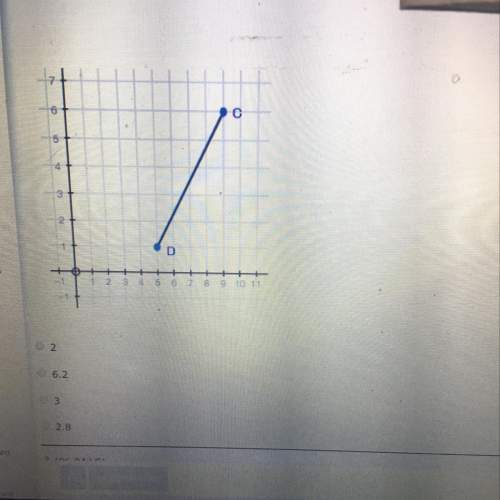
The graph below shows the line of best fit for data collected on the depth, in feet, and velocity, in feet per second, at ten points along the columbia river. which of the following is the equation of the line of best fit? a. y = -6.67x + 13 b. y = -6.67x + 2.1 c. y = -0.15x + 1.95 d. y = -0.15x + 0.15

Answers: 1


Another question on Mathematics

Mathematics, 21.06.2019 17:00
How many of the 250 grandparents in the population would you expect to prefer online shopping with merchant a? merchant a: 4 merchant b: 6 merchant c: 2 merchant d: 3 other: 5 none: 5 answer choices: a.about 4 b.about 8 c.about 40 d.about 21
Answers: 1


Mathematics, 21.06.2019 20:50
The first side of a triangle measures 5 in less than the second side, the third side is 3 in more than the first side, and the perimeter is 17 in. how long is the third side? if s represents the length of the second side, which of the following represents the length of the third side? s-5 ws-2 s+ 3 next question ask for turn it in
Answers: 1

Mathematics, 22.06.2019 01:00
Suppose m: angle a =77 degrees what is the measure of a complement of a complement of angle a, what is a conclusion you can draw about a complement of a complement of an angle
Answers: 1
You know the right answer?
The graph below shows the line of best fit for data collected on the depth, in feet, and velocity, i...
Questions


Social Studies, 29.06.2019 21:00


English, 29.06.2019 21:00

Mathematics, 29.06.2019 21:00

History, 29.06.2019 21:00


Geography, 29.06.2019 21:00

English, 29.06.2019 21:00


Social Studies, 29.06.2019 21:00


Social Studies, 29.06.2019 21:00


Mathematics, 29.06.2019 21:00

Mathematics, 29.06.2019 21:00


