
Mathematics, 27.06.2019 10:10 supergraciepie
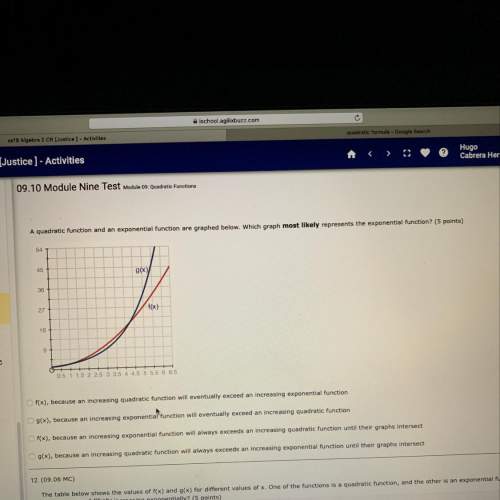
Aquadratic function and an exponential function are graphed below. which graph most likely represents the exponential function?
0.5
1 1.5 2 2.5
3 3.5 4 4.5 5 5.5 6 6.5

Answers: 1


Another question on Mathematics
Mathematics, 21.06.2019 20:00
The table shows the age and finish time of ten runners in a half marathon. identify the outlier in this data set. drag into the table the ordered pair of the outlier and a reason why that point is an outlier.
Answers: 1
Mathematics, 21.06.2019 21:50
Aline passes through the point (–7, 5) and has a slope of 1/2 which is another point that the line passes through?
Answers: 3
Mathematics, 21.06.2019 22:30
If a line is defined by the equation y = 5x + 2, what is the slope?
Answers: 2
You know the right answer?
Aquadratic function and an exponential function are graphed below. which graph most likely represent...
Questions


Mathematics, 23.04.2021 01:00

Social Studies, 23.04.2021 01:00
Mathematics, 23.04.2021 01:00

English, 23.04.2021 01:00
Mathematics, 23.04.2021 01:00

Mathematics, 23.04.2021 01:00
Mathematics, 23.04.2021 01:00

Mathematics, 23.04.2021 01:00
English, 23.04.2021 01:00
Mathematics, 23.04.2021 01:00


