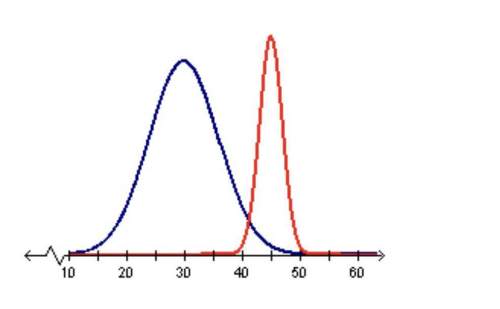
The graph below shows two normal distributions.
what is the difference of the means of the dis...

Mathematics, 01.07.2019 08:10 ctyrector
The graph below shows two normal distributions.
what is the difference of the means of the distributions?

Answers: 1


Another question on Mathematics
Mathematics, 21.06.2019 22:30
What is the approximate value of x in the equation below.–3.396–0.7080.3040.955
Answers: 1
Mathematics, 21.06.2019 23:00
Qrst is a parallelogram. determine the measure of ∠q pls
Answers: 2
Mathematics, 22.06.2019 01:30
Have you ever been in the middle of telling a story and had to use hand gestures or even a drawing to make your point? in algebra, if we want to illustrate or visualize a key feature of a function, sometimes we have to write the function in a different form—such as a table, graph, or equation—to determine the specific key feature we’re looking for. think about interactions with others and situations you’ve come across in your own life. how have you had to adjust or change the way you represented something based on either the concept you were trying to describe or the person you were interacting with? explain how the complexity or layout of the concept required you to change your style or presentation, or how the person’s unique learning style affected the way you presented the information.
Answers: 1
You know the right answer?
Questions


Biology, 19.12.2019 06:31

Business, 19.12.2019 06:31

Chemistry, 19.12.2019 06:31
English, 19.12.2019 06:31

Spanish, 19.12.2019 06:31


