How could you adjust the line in this scatter plot to make it a line of best fit?
a. increase...

Mathematics, 10.07.2019 17:10 TelestoisaMoon4437
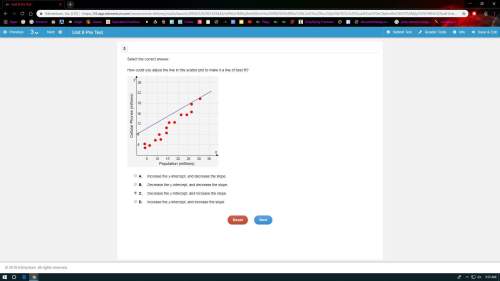
How could you adjust the line in this scatter plot to make it a line of best fit?
a. increase the y-intercept, and decrease the slope.
b. decrease the y-intercept, and decrease the slope.
c. decrease the y-intercept, and increase the slope.
d. increase the y-intercept, and increase the slope.

Answers: 3


Another question on Mathematics
Mathematics, 21.06.2019 16:30
The label on the car's antifreeze container claims to protect the car between ? 40°c and 125°c. to convert celsius temperature to fahrenheit temperature, the formula is c = 5 over 9 (f ? 32). write and solve the inequality to determine the fahrenheit temperature range at which this antifreeze protects the car. ? 40 > 5 over 9 (f ? 32) > 125; ? 40 > f > 257 ? 40 < 5 over 9 (f ? 32) < 125; ? 40 < f < 257 ? 40 < 5 over 9 (f ? 32); ? 40 < f 5 over 9 (f ? 32) < 125; f < 257
Answers: 2
Mathematics, 22.06.2019 00:30
Afurniture store is having a weekend sale and is offering a 20% discount on patio chairs and tables the sales tax on furniture is 6.25%
Answers: 3
Mathematics, 22.06.2019 01:30
Use the given degree of confidence and sample data to construct a confidence interval for the population mean mu . assume that the population has a normal distribution. a laboratory tested twelve chicken eggs and found that the mean amount of cholesterol was 185 milligrams with sequals 17.6 milligrams. a confidence interval of 173.8 mgless than muless than 196.2 mg is constructed for the true mean cholesterol content of all such eggs. it was assumed that the population has a normal distribution. what confidence level does this interval represent?
Answers: 1
Mathematics, 22.06.2019 01:40
(co 3) the soup produced by a company has a salt level that is normally distributed with a mean of 5.4 grams and a standard deviation of 0.3 grams. the company takes readings of every 10th bar off the production line. the reading points are 5.8, 5.9, 4.9, 6.5, 5.0, 4.9, 6.2, 5.1, 5.7, 6.1. is the process in control or out of control and why? it is out of control as two of these data points are more than 2 standard deviations from the mean it is in control as the data points more than 2 standard deviations from the mean are far apart it is out of control as one of these data points is more than 3 standard deviations from the mean it is in control as the values jump above and below the mean
Answers: 2
You know the right answer?
Questions

Mathematics, 02.07.2019 22:00


Geography, 02.07.2019 22:00
History, 02.07.2019 22:00

Social Studies, 02.07.2019 22:00
Mathematics, 02.07.2019 22:00
Social Studies, 02.07.2019 22:00
Mathematics, 02.07.2019 22:00
Mathematics, 02.07.2019 22:00


