Which mapping diagrams represent functions (choose all that apply)
which mapping diagrams repr...

Mathematics, 13.07.2019 22:20 Cheyenne7327
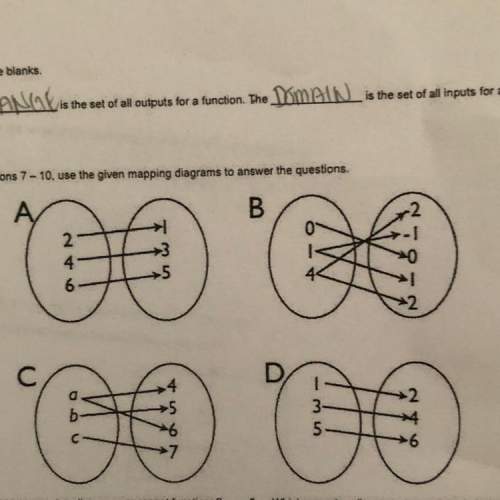
Which mapping diagrams represent functions (choose all that apply)
which mapping diagrams represent relations that are not functions (choose all that apply)
in mapping diagram d what is the domain
in mapping diagram d what is the range

Answers: 1


Another question on Mathematics
Mathematics, 21.06.2019 14:10
Line cd passes through points c(1, 3) and d(4, –3). if the equation of the line is written in slope-intercept form, y = mx + b, what is the value of b? –5 –2 1 5
Answers: 2
Mathematics, 21.06.2019 16:30
In two or more complete sentences, formulate how to use technology to calculate the appropriate regression model for the given data. you are not required to find the model, just choose the appropriate regression and explain how to use the technology. (-5,,2.,0.8), (0,-0.5), (2,-1.3), (3,-0.8), (5,2)
Answers: 2
Mathematics, 21.06.2019 20:00
Ialready asked this but i never got an answer. will give a high rating and perhaps brainliest. choose the linear inequality that describes the graph. the gray area represents the shaded region. y ≤ –4x – 2 y > –4x – 2 y ≥ –4x – 2 y < 4x – 2
Answers: 1
Mathematics, 21.06.2019 21:00
Rewrite the following quadratic functions in intercept or factored form. show your work. f(x) = 3x^2 - 12
Answers: 1
You know the right answer?
Questions

Chemistry, 20.09.2020 19:01


Social Studies, 20.09.2020 19:01

Health, 20.09.2020 19:01
Mathematics, 20.09.2020 19:01
Mathematics, 20.09.2020 19:01
Mathematics, 20.09.2020 19:01

Mathematics, 20.09.2020 19:01


