
Mathematics, 13.08.2019 02:20 ameyl
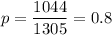
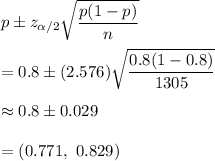
Suppose a sample of 1305 tenth graders is drawn. of the students sampled, 1044 read above the eighth grade level. using the data, construct the 99% confidence interval for the population proportion of tenth graders reading at or below the eighth grade level. round your answers to three decimal places.

Answers: 1


Another question on Mathematics
Mathematics, 21.06.2019 19:00
Which graph represents the parent function of y=(x+2)(x-2)
Answers: 1
Mathematics, 22.06.2019 00:30
Can someone me immediately, this is due by midnight! if you can't see the question, i'll text it to you. show the steps you took to get your answer.
Answers: 2
Mathematics, 22.06.2019 02:20
Which of these could you find on a credit report? check all that apply. previous address current employer highest level of education completed bankruptcy and a civil court case monthly income late credit card payments
Answers: 2
Mathematics, 22.06.2019 04:00
I'm confused on how to solve the triangle. can someone me ?
Answers: 2
You know the right answer?
Suppose a sample of 1305 tenth graders is drawn. of the students sampled, 1044 read above the eighth...
Questions


Biology, 22.05.2021 01:10

Mathematics, 22.05.2021 01:10
Mathematics, 22.05.2021 01:10
Mathematics, 22.05.2021 01:10

Mathematics, 22.05.2021 01:10

Mathematics, 22.05.2021 01:10
Mathematics, 22.05.2021 01:10

Mathematics, 22.05.2021 01:10


