
Mathematics, 19.08.2019 19:10 kim95207
Leeann wants to organize her data from researching the effect of hours of sunlight on plant growth to see if there is a trend in the data. which would be the best way for leeann to display her data for analysis so she can make predictions about the amount of light needed for maximum growth? a. in a line graphb. in a data tablec. in an area graphd. in a pie graph

Answers: 1


Another question on Mathematics
Mathematics, 21.06.2019 15:30
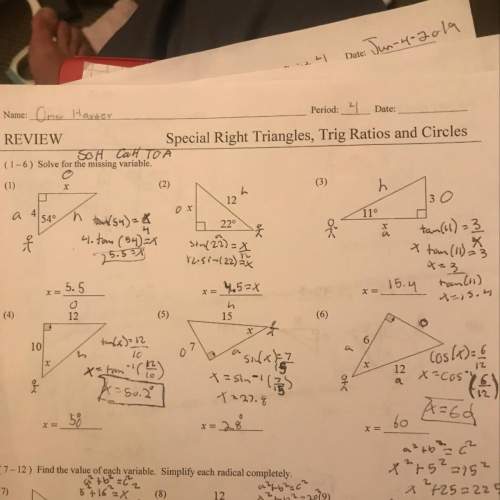
The triangles are similar. what is the value of x? show your work.
Answers: 1
Mathematics, 21.06.2019 17:00
Pam buys a sleeve of ball bearings for her skateboard. each of the bearings is 1 1/5 inches wide. the sleeve is 9 3/5 inches long. how many ball bearings are in the sleeve? show your work.
Answers: 3
Mathematics, 21.06.2019 17:00
What is the difference between the points (4, 7) and (4, -5)? a. 0 units b. 2 units c. 4 units d. 12 units
Answers: 1
Mathematics, 21.06.2019 19:30
Koji is installing a rectangular window in an office building. the window is 823 feet wide and 534 feet high. the formula for the area of a rectangle is a=bh. what is the area of the window? enter your answer as a mixed number in simplest form in the box. $$ ft2
Answers: 1
You know the right answer?
Leeann wants to organize her data from researching the effect of hours of sunlight on plant growth t...
Questions

Mathematics, 18.03.2020 01:28


Biology, 18.03.2020 01:28


Chemistry, 18.03.2020 01:28
Mathematics, 18.03.2020 01:45
Mathematics, 18.03.2020 01:46
Mathematics, 18.03.2020 01:46
Mathematics, 18.03.2020 01:46


