
Mathematics, 25.08.2019 00:30 arianayoung
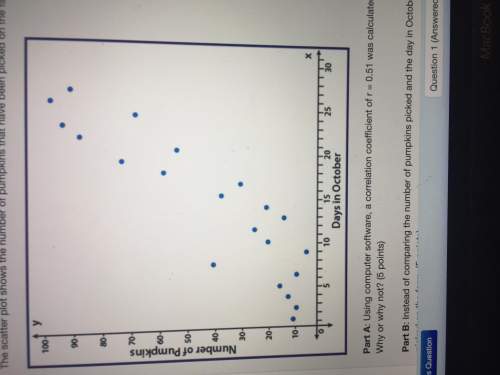
50 points the scatter plot shows the number of pumpkins that have been picked on the farm during the month of october:
a scatter plot with points showing an upward trend with points that are moderately spread out from a line of best fit. the y axis is labeled number of pumpkins and the x axis is labeled days in october
part a: using computer software, a correlation coefficient of r = 0.51 was calculated. based on the scatter plot, is that an accurate value for this data? why or why not?
part b: instead of comparing the number of pumpkins picked and the day in october, write a scenario that would be a causal relationship for pumpkins picked on the farm

Answers: 2


Another question on Mathematics
Mathematics, 21.06.2019 17:00
Can someone me i’m confused. will give brainliest and a whole bunch of points
Answers: 2
Mathematics, 21.06.2019 20:00
Ke’ajah has a coupon for 1/3 off the regular price, t, of a tent. which expression represents the price of the tent using the coupon? select the two correct expressions. a. 1/3t b. 2/3t c. t - 1/3 d. t - 2/3 e. t - 1/3t f. t - 2/3t
Answers: 1
Mathematics, 22.06.2019 04:00
Which is the standard form for this number? (2 x 10) + (5 x 1) + (8 x 1 10,000 )
Answers: 1
You know the right answer?
50 points the scatter plot shows the number of pumpkins that have been picked on the farm during the...
Questions

Biology, 22.07.2020 14:01


Advanced Placement (AP), 22.07.2020 14:01

Business, 22.07.2020 14:01
Mathematics, 22.07.2020 14:01
Mathematics, 22.07.2020 14:01

Mathematics, 22.07.2020 14:01
Mathematics, 22.07.2020 14:01
Biology, 22.07.2020 14:01
English, 22.07.2020 14:01
Mathematics, 22.07.2020 14:01
Mathematics, 22.07.2020 14:01
Mathematics, 22.07.2020 14:01


