
Mathematics, 29.08.2019 22:30 tahmidtaj150
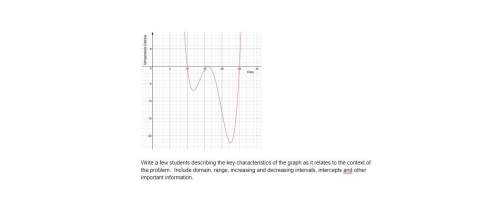
The graph below shows the curve of best fit that represents the low temperatures for everyday in december in denver, colorado.
write a few sentences describing the key characteristics of the graph as it relates to the context of the problem. include domain, range, increasing and decreasing intervals, intercepts and other important information

Answers: 1


Another question on Mathematics
Mathematics, 21.06.2019 18:20
Alana has 12.5 cups of flour with which she is baking four loaves of raisin bread and one large pretzel. the pretzel requires 2.5 cups of flour to make. how much flour is in each loaf of raisin bread? explain the steps to follow to get the answer.
Answers: 3
Mathematics, 21.06.2019 18:50
Aresearch group wants to find the opinions’ of city residents on the construction of a new downtown parking garage. what is the population of the survey downtown shoppers downtown visitors downtown workers city residents
Answers: 3
Mathematics, 21.06.2019 19:00
At $1.32 million, they closed last month percent above what they paid in 2007." how much did they pay in 2007?
Answers: 1
You know the right answer?
The graph below shows the curve of best fit that represents the low temperatures for everyday in dec...
Questions


Mathematics, 23.02.2021 23:10
History, 23.02.2021 23:10

Health, 23.02.2021 23:10
Mathematics, 23.02.2021 23:10
Mathematics, 23.02.2021 23:10

Biology, 23.02.2021 23:10

Spanish, 23.02.2021 23:10
Mathematics, 23.02.2021 23:10
Mathematics, 23.02.2021 23:10
Mathematics, 23.02.2021 23:10


