 and
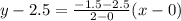
and  , then the equation of line is
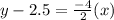
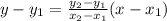
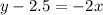


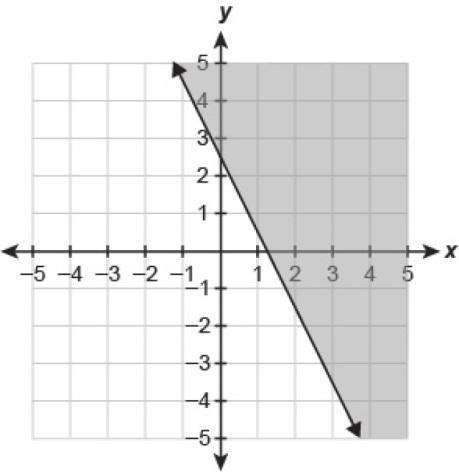
Which inequality is represented by the graph?
a) y≥−12x+2.5
b) y> −2x+2.5
c) y...

Mathematics, 12.09.2019 23:20 emmawytko
Which inequality is represented by the graph?
a) y≥−12x+2.5
b) y> −2x+2.5
c) y≥−2x+2.5
d) y≤−2x+2.5

Answers: 1


Another question on Mathematics
Mathematics, 21.06.2019 22:30
Ineed big ! the cost of a school banquet is $25 plus $15 for each person attending. create a table, sketch the graph, and write an equation in slope-intercept and point-slope form that gives total cost as a function of the number of people attending. what is the cost for 77 people?
Answers: 1
Mathematics, 22.06.2019 03:00
25 ! what is the value of x? enter your answer in the box. x =
Answers: 2
You know the right answer?
Questions

Biology, 20.12.2021 14:50


Physics, 20.12.2021 14:50
Mathematics, 20.12.2021 14:50
Mathematics, 20.12.2021 14:50
Mathematics, 20.12.2021 14:50
Mathematics, 20.12.2021 14:50


Mathematics, 20.12.2021 14:50
Mathematics, 20.12.2021 14:50
Mathematics, 20.12.2021 14:50
Mathematics, 20.12.2021 14:50
Mathematics, 20.12.2021 14:50
Biology, 20.12.2021 14:50


