
Mathematics, 13.09.2019 19:30 breena68
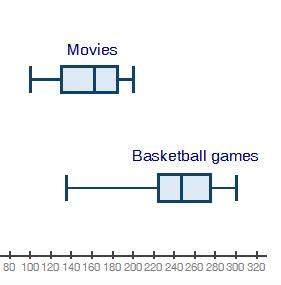
The box plots below show attendance at a local movie theater and high school basketball games:
which of the following best describes how to measure the spread of the data? (1 point)
the iqr is a better measure of spread for movies than it is for basketball games.
the standard deviation is a better measure of spread for movies than it is for basketball games.
the iqr is the best measurement of spread for games and movies.
the standard deviation is the best measurement of spread for games and movies.

Answers: 1


Another question on Mathematics
Mathematics, 21.06.2019 16:40
According to the number line, what is the distance between points a and b? v ++ + + + + -16 -14 -12 -10 -8 + 6 + 4 + -2 + 0 + 2 + 4 + 6 + 8 + 10 + 12 + 14 + 16 o6 units o 7 units 12 units o 14 units
Answers: 1
Mathematics, 21.06.2019 22:30
Olga bought a new skirt that cost $20. sales tax is 5%. how much did olga pay, including sales tax? 7.
Answers: 2
Mathematics, 21.06.2019 23:00
Astore sells 4 apples for $3 and 3 oranges for $4 if pete buys 12 apples and 12 oranges how much will it cost
Answers: 1
Mathematics, 22.06.2019 00:50
Answer asap. you begin with 1/2 scoop of ice cream. since you're hungry, you ask the vendor for 2/7 more scoops of ice cream. then, you eat 5/8 scoops. how many scoops of ice cream are left on your cone? i will mark brainliest for first correct answer.
Answers: 2
You know the right answer?
The box plots below show attendance at a local movie theater and high school basketball games:
Questions


History, 26.02.2020 06:23
Mathematics, 26.02.2020 06:23
Mathematics, 26.02.2020 06:23
Mathematics, 26.02.2020 06:23

Biology, 26.02.2020 06:23
History, 26.02.2020 06:24

Mathematics, 26.02.2020 06:24

History, 26.02.2020 06:24

Mathematics, 26.02.2020 06:25
Mathematics, 26.02.2020 06:25


