30 points!
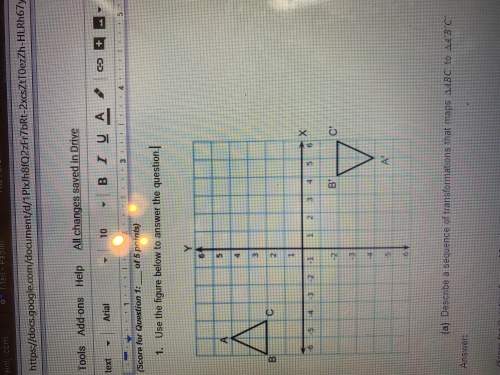
describe a sequence of transformations that maps ^abc to ^a’b’c’
...

Mathematics, 18.09.2019 22:10 vultuxx
30 points!
describe a sequence of transformations that maps ^abc to ^a’b’c’

Answers: 1


Another question on Mathematics
Mathematics, 21.06.2019 13:00
Which statement best describes a square? a. a special rectangle that has four right angles b. a special trapezoid that has four sides of equal length c. a special rectangle that has four sides of equal length d. a special trapezoid that has four right angles
Answers: 1
Mathematics, 21.06.2019 13:00
Acar traveling at 65 mph leaves 25 foot skid mark what is the ratio of the speed to length of skid mark (feet) in the simplest form
Answers: 1
Mathematics, 21.06.2019 16:00
Part one: measurements 1. measure your own height and arm span (from finger-tip to finger-tip) in inches. you will likely need some from a parent, guardian, or sibling to get accurate measurements. record your measurements on the "data record" document. use the "data record" to you complete part two of this project. name relationship to student x height in inches y arm span in inches archie dad 72 72 ginelle mom 65 66 sarah sister 64 65 meleah sister 66 3/4 67 rachel sister 53 1/2 53 emily auntie 66 1/2 66 hannah myself 66 1/2 69 part two: representation of data with plots 1. using graphing software of your choice, create a scatter plot of your data. predict the line of best fit, and sketch it on your graph. part three: the line of best fit include your scatter plot and the answers to the following questions in your word processing document 1. 1. which variable did you plot on the x-axis, and which variable did you plot on the y-axis? explain why you assigned the variables in that way. 2. write the equation of the line of best fit using the slope-intercept formula $y = mx + b$. show all your work, including the points used to determine the slope and how the equation was determined. 3. what does the slope of the line represent within the context of your graph? what does the y-intercept represent? 5. use the line of best fit to you to describe the data correlation.
Answers: 2
Mathematics, 21.06.2019 19:00
Acompany manufactures large valves, packed in boxes. a shipment consists of 1500 valves packed in 75 boxes. each box has the outer dimensions 1.2 x 0.8 x 1.6 m and the inner dimensions 1.19 x 0.79 x 1.59 m. the boxes are loaded on a vehicle (truck + trailer). the available capacity in the vehicle combination is 140 m3. each valve has a volume of 0.06 m3. - calculate the load factor on the box level (%). - calculate the load factor on the vehicle level (%). - calculate the overall load factor (%).
Answers: 1
You know the right answer?
Questions

Spanish, 04.02.2020 23:50
Mathematics, 04.02.2020 23:50
Mathematics, 04.02.2020 23:50

Chemistry, 04.02.2020 23:50


Advanced Placement (AP), 04.02.2020 23:50
Mathematics, 04.02.2020 23:50
History, 04.02.2020 23:50
History, 04.02.2020 23:50
Mathematics, 04.02.2020 23:50


Arts, 04.02.2020 23:50
History, 04.02.2020 23:50


Computers and Technology, 04.02.2020 23:50


