5. the dot plot represents the distribution of wages earned during a one-week period
by 12 coll...

Mathematics, 23.09.2019 09:30 jfrey7621
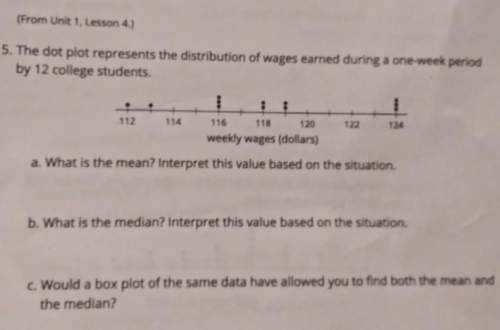
5. the dot plot represents the distribution of wages earned during a one-week period
by 12 college students.
. 112 114 116 118 120 122 124
weekly wages (dollars)
a. what is the mean? interpret this value based on the situation.
b. what is the median? interpret this value based on the situation.
c. would a box plot of the same data have allowed you to find both the mean and
the median?

Answers: 1


Another question on Mathematics
Mathematics, 21.06.2019 18:30
Which equation represents the model shown? a)1/3 divide 1/6 = 2 b)2/3 divide 1/6 = 2/18 c)1/3 divide 1/6 = 1/18 d)2/3 divide 1/6 =4
Answers: 1
Mathematics, 21.06.2019 19:00
Which shows one way to determine the factors of 4x3 + x2 – 8x – 2 by grouping?
Answers: 1
Mathematics, 22.06.2019 00:00
Idon't get undoing if its pass adding and subtracting so can someone ? x-2 over 5 = 18
Answers: 1
Mathematics, 22.06.2019 00:10
A, at (-2, 4), is 6 .of a'? (-8, 4) (-8, -2) (-2, -2) (-2, 4) b, at (-4, -7), isy-.of b'? (-4, 7) (4, -7) (4, 7) (-4, -7)
Answers: 2
You know the right answer?
Questions

Chemistry, 12.05.2021 04:50

Business, 12.05.2021 04:50

Computers and Technology, 12.05.2021 04:50
Mathematics, 12.05.2021 04:50
Mathematics, 12.05.2021 04:50

Advanced Placement (AP), 12.05.2021 04:50

Biology, 12.05.2021 04:50
Biology, 12.05.2021 04:50
Mathematics, 12.05.2021 04:50

English, 12.05.2021 04:50
Mathematics, 12.05.2021 04:50
Mathematics, 12.05.2021 05:00


