The graph shows the distance a car traveled, y, in x hours:
a coordinate plane graph is shown...

Mathematics, 24.09.2019 21:30 nickespinosa11
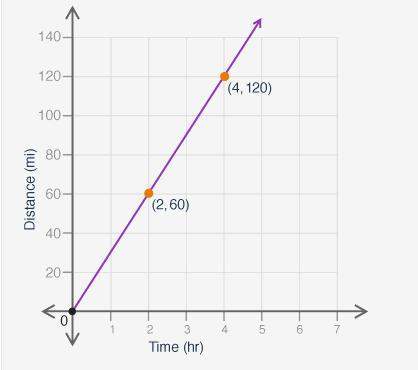
The graph shows the distance a car traveled, y, in x hours:
a coordinate plane graph is shown. the x-axis is labeled time in hours ,and the y-axis is labeled distance in miles. the line passes through the points 2 comma 60, and 4 comma 120.
what is the rise-over-run value for the relationship represented in the graph?
20
30
1 over 20
1 over 30

Answers: 2


Another question on Mathematics
Mathematics, 21.06.2019 14:20
Zahra was given two data sets, one without an outlier and one with an outlier. data without an outlier: 15, 19, 22, 26, 29 data with an outlier: 15, 19, 22, 26, 29, 81
Answers: 3
Mathematics, 21.06.2019 20:30
Lola says these two expressions have the same value. expression a expression b which explains whether lola is correct?
Answers: 2
Mathematics, 22.06.2019 00:00
Which of the following will form the composite function?
Answers: 3
You know the right answer?
Questions

Social Studies, 16.01.2021 01:00

Chemistry, 16.01.2021 01:00
Mathematics, 16.01.2021 01:00

Mathematics, 16.01.2021 01:00
Mathematics, 16.01.2021 01:00

Physics, 16.01.2021 01:00
Mathematics, 16.01.2021 01:00

Mathematics, 16.01.2021 01:00

Mathematics, 16.01.2021 01:00


