
Mathematics, 25.09.2019 00:30 jenna34032
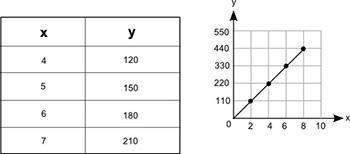
The table and the graph below each show a different relationship between the same two variables, x and y:
how much more would the value of y be on the graph than its value in the table when x = 12?
150
300
450
600

Answers: 3


Another question on Mathematics
Mathematics, 21.06.2019 12:50
2-digit numbers less than 91 which are 1 less than a multiple of 10
Answers: 1
Mathematics, 21.06.2019 20:30
Max recorded the heights of 500 male humans. he found that the heights were normally distributed around a mean of 177 centimeters. which statements about max’s data must be true? a) the median of max’s data is 250 b) more than half of the data points max recorded were 177 centimeters. c) a data point chosen at random is as likely to be above the mean as it is to be below the mean. d) every height within three standard deviations of the mean is equally likely to be chosen if a data point is selected at random.
Answers: 2
Mathematics, 21.06.2019 21:00
The ph level of a blueberry is 3.1 what is the hydrogen-ion concentration [h+] for the blueberry
Answers: 2
You know the right answer?
The table and the graph below each show a different relationship between the same two variables, x a...
Questions
Mathematics, 15.07.2019 14:00

History, 15.07.2019 14:00

Mathematics, 15.07.2019 14:00
Mathematics, 15.07.2019 14:00
Mathematics, 15.07.2019 14:00

Physics, 15.07.2019 14:00
History, 15.07.2019 14:00
History, 15.07.2019 14:00

English, 15.07.2019 14:00
Physics, 15.07.2019 14:00
English, 15.07.2019 14:00
Mathematics, 15.07.2019 14:00


