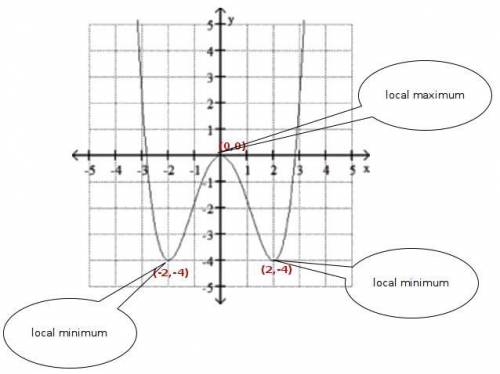
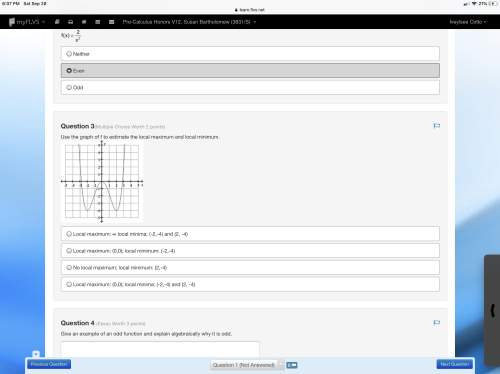
Use the graph of f to estimate the local maximum and local minimum.
a quartic graph is shown....

Mathematics, 29.09.2019 02:20 Undrea43
Use the graph of f to estimate the local maximum and local minimum.
a quartic graph is shown. the graph intercepts the x axis at approximately -2.8, 0, and 2.8.
a. local maximum: ∞ local minima: (-2,-4) and (2, -4)
b. local maximum: (0,0); local minimum: (-2,-4)
c. no local maximum; local minimum: (2,-4)
d. local maximum: (0,0); local minima: (-2,-4) and (2, -4)

Answers: 1


Another question on Mathematics
Mathematics, 21.06.2019 17:00
Two streets intersect at a 30- degree angle. at the intersection, the are four crosswalks formed that are the same length. what type of quadrilateral is formed by the crosswalks?
Answers: 3
Mathematics, 21.06.2019 18:00
If the cost to mail a package is an initial $5 and $0.28 for every pound the total cost to mail a package was $11.27, how much did the package weigh?
Answers: 1
Mathematics, 21.06.2019 19:30
Bobby bought 1.12 pounds of turkey at a cost of 2.50 per pound. carla bought 1.4 pounds of turkey at a cost of 2.20 per pound. who spent more and by much?
Answers: 2
You know the right answer?
Questions

Chemistry, 15.01.2021 22:40
Mathematics, 15.01.2021 22:40

Arts, 15.01.2021 22:40

Mathematics, 15.01.2021 22:40
Chemistry, 15.01.2021 22:40


Mathematics, 15.01.2021 22:40
Biology, 15.01.2021 22:40
Mathematics, 15.01.2021 22:40
Mathematics, 15.01.2021 22:40
Biology, 15.01.2021 22:40

Mathematics, 15.01.2021 22:40


