 )
)
Which graphs represent functions with the following key features?
• positive on (-infin...

Mathematics, 01.10.2019 03:00 alex7881
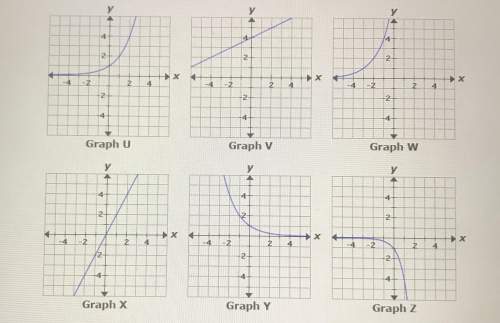
Which graphs represent functions with the following key features?
• positive on (-infinity, infinity)
• increasing on (-infinity, infinity)
• approaches 0 as x approaches -infinity

Answers: 1


Another question on Mathematics
Mathematics, 21.06.2019 17:00
The table shows population statistics for the ages of best actor and best supporting actor winners at an awards ceremony. the distributions of the ages are approximately bell-shaped. compare the z-scores for the actors in the following situation. best actor best supporting actor muequals42.0 muequals49.0 sigmaequals7.3 sigmaequals15 in a particular year, the best actor was 59 years old and the best supporting actor was 45 years old. determine the z-scores for each. best actor: z equals best supporting actor: z equals (round to two decimal places as needed.) interpret the z-scores. the best actor was (more than 2 standard deviations above more than 1 standard deviation above less than 1 standard deviation above less than 2 standard deviations below) the mean, which (is not, is) unusual. the best supporting actor was (less than 1 standard deviation below more than 1 standard deviation above more than 2 standard deviations below more than 1 standard deviation below) the mean, which (is is not) unusual.
Answers: 1
Mathematics, 21.06.2019 18:50
Jermaine has t subway tokens. karen has 4 more subway tokens than jermaine. raul has 5 fewer subway tokens than jermaine. which expression represents the ratio of karen's tokens to raul's tokens
Answers: 1
You know the right answer?
Questions

Social Studies, 18.10.2019 14:30
Social Studies, 18.10.2019 14:30

Computers and Technology, 18.10.2019 14:30


Computers and Technology, 18.10.2019 14:30

Spanish, 18.10.2019 14:30
English, 18.10.2019 14:30
Mathematics, 18.10.2019 14:30
Mathematics, 18.10.2019 14:30

Advanced Placement (AP), 18.10.2019 14:30

Geography, 18.10.2019 14:30

Health, 18.10.2019 14:30


