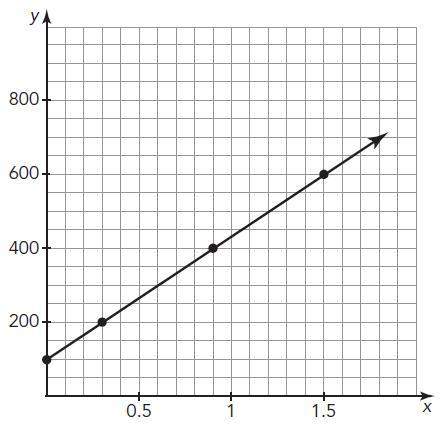
Consider the graph shown.
a graph is shown in the xy-plane. the values on the x-axis ran...

Mathematics, 01.10.2019 21:10 jjcw000
Consider the graph shown.
a graph is shown in the xy-plane. the values on the x-axis ranges from 0 to 1 decimal point 5 in increments of 0 decimal point 5 and the values on the y-axis ranges from 0 to 800 in increments of 200. a line starts from a point 100 on the y-axis, goes up, and passes through the points (0, 100), (0 decimal point 3, 200), (0 decimal point 9, 400), and (1 decimal point 5, 600).
determine if the graph shows two quantities that vary directly. if possible, determine the constant of proportionality. explain your reasoning.

Answers: 3


Another question on Mathematics
Mathematics, 21.06.2019 17:00
Complete the equation of the line through (−10,3) and (−8,−8). use exact numbers.
Answers: 1
Mathematics, 21.06.2019 21:30
If you flip a coin 3 times, what is the probability of flipping heads 3 times? a. p(3 heads) = 3/8 b. p(3 heads) = 1/6 c. p(3 heads) = 1/8 d. p(3 heads) = 1/2
Answers: 2
Mathematics, 22.06.2019 00:20
Biggest exam of the which of the following are polynomial functions?
Answers: 1
You know the right answer?
Questions

History, 08.07.2019 00:00

English, 08.07.2019 00:00
English, 08.07.2019 00:00
Mathematics, 08.07.2019 00:00
History, 08.07.2019 00:00
Mathematics, 08.07.2019 00:00

Health, 08.07.2019 00:00


Chemistry, 08.07.2019 00:00
English, 08.07.2019 00:00


Computers and Technology, 08.07.2019 00:00
English, 08.07.2019 00:00
Mathematics, 08.07.2019 00:00
English, 08.07.2019 00:00


