Mathematics, 04.10.2019 22:00 juliah6925
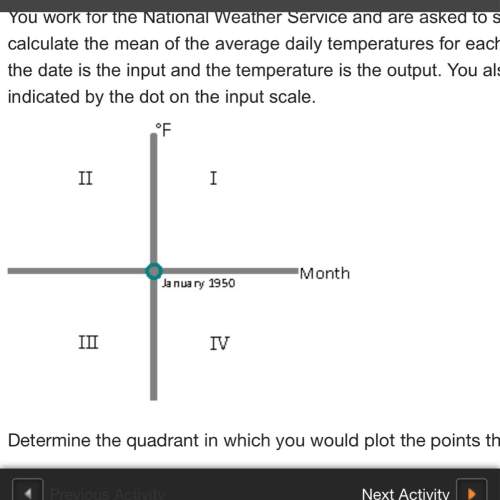
You work for the national weather service and are asked to study the average daily temperatures in anchorage, alaska. you calculate the mean of the average daily temperatures for each month. you decide to place the information on a graph in which the date is the input and the temperature is the output. you also decide that january 1950 will correspond to the month 0 as indicated by the dot on the input scale.
determine the quadrant in which you would plot the points that correspond to the following data:
the average daily temperature for january 1936 was
a.
quadrant iii
b.
quadrant iv
c.
quadrant ii


Answers: 2


Another question on Mathematics

Mathematics, 21.06.2019 20:30
Aswimming pool measures 22ft by 12ft and is 4ft deep. if the pool is being filled at 2.5 cubic ft per minute, how long will it take to fill the pool?
Answers: 1


Mathematics, 21.06.2019 22:30
Tommy buys a sweater that is on sale for 40% off the original price. the expression p -0.4p can be used to find the sale price of the sweater, where p is the original price of the sweater. if the original price of the sweater is 50, what is the sale price?
Answers: 1

Mathematics, 21.06.2019 23:40
What is the area of a rectangle with vertices (-8,-2), (-3,-2), (-3,-6), and (-8,-6)? units
Answers: 1
You know the right answer?
You work for the national weather service and are asked to study the average daily temperatures in a...
Questions


English, 10.11.2020 20:20

Mathematics, 10.11.2020 20:20


Social Studies, 10.11.2020 20:20


Mathematics, 10.11.2020 20:20


Chemistry, 10.11.2020 20:20


Advanced Placement (AP), 10.11.2020 20:20


Mathematics, 10.11.2020 20:20


Social Studies, 10.11.2020 20:20


