Labor lab (2008) nyt
1) how many people (in the millions) in april of 2008 were looking for a...

Mathematics, 07.10.2019 01:10 annamcda301
Labor lab (2008) nyt
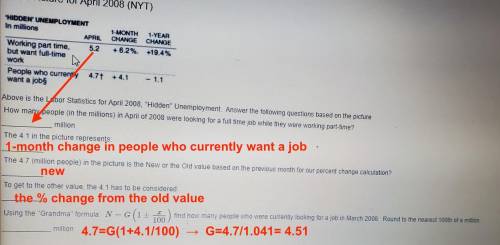
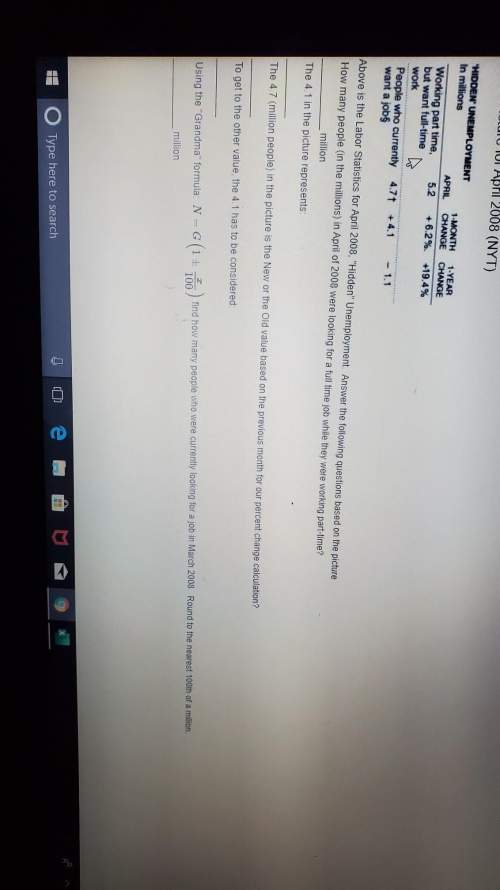
1) how many people (in the millions) in april of 2008 were looking for a full-time job while they were working part time?
2) the 4.1 in the picture represents?
3) the 4.7 (million people) in the picture is the new or the old value based on the previous month for our percent change calculation?
4) to get to the other value, the 4.1 has to be considered:
5) using the "grandma" formula: n=g(1+x/100) find how many people who were currently looking for a job in march 2008. round to the nearest 100th of a million.

Answers: 2


Another question on Mathematics
Mathematics, 21.06.2019 17:00
Which expression is equivalent to the expression shown?
Answers: 2
Mathematics, 22.06.2019 00:30
Which equation could represent the relationship shown in the scatter plot? y=−3x−2 y=−3/4x+10 y=−2/3x+1 y=9x−12 scatter plot with x axis labeled variable x and y axis labeled variable y. points go from upper left to lower right.
Answers: 1
Mathematics, 22.06.2019 04:00
The perimeter of the rectangle is 120 feet. if the length of the rectangle is ten feet more than the width ,what are the dimensions (length and width) of the rectangle?
Answers: 1
Mathematics, 22.06.2019 07:10
The function f(x) is shown on the graph. what is f(0)? a. 0 only b. –6 only c. –2, 1, 1, and 3 only d. –6, –2, 1, 1, and 3 only
Answers: 2
You know the right answer?
Questions

Geography, 25.06.2019 06:30

Mathematics, 25.06.2019 06:30
Mathematics, 25.06.2019 06:30


Social Studies, 25.06.2019 06:30
Social Studies, 25.06.2019 06:30
Mathematics, 25.06.2019 06:30
Mathematics, 25.06.2019 06:30
English, 25.06.2019 06:30
English, 25.06.2019 06:30


