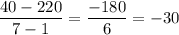
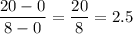

Consider the following graphs.
determine the rate of change shown in each graph and deter...

Mathematics, 09.10.2019 23:00 jackieanguiano3700
Consider the following graphs.
determine the rate of change shown in each graph and determine if each is positive or negative.
restate the rate of change as a unit rate for each graph. explain its meaning.
tell whether the graphs represent proportional relationships. explain your reasoning


Answers: 3


Another question on Mathematics
Mathematics, 21.06.2019 16:00
The equation x2 – 1x – 90 = 0 has solutions {a, b}. what is a + b?
Answers: 1
Mathematics, 21.06.2019 23:30
Answer each of the questions for the following diagram: 1. what type of angles are these? 2. solve for x. what does x equal? 3. what is the measure of the angles?
Answers: 1
Mathematics, 22.06.2019 00:30
Simplify the given expression leaving the answer in improper fraction form. 2/3+5/6
Answers: 2
You know the right answer?
Questions


Business, 03.01.2020 20:31

Social Studies, 03.01.2020 20:31
Social Studies, 03.01.2020 20:31

Computers and Technology, 03.01.2020 20:31


