
Mathematics, 10.10.2019 01:30 Tringirl233
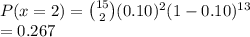
Approximately 10% of people are left-handed. if 15 people are selected at random, what is the probability exactly 2 are left-handed? use the binomialpdf(n, p, x) command on your calculator with the single option for the ti36x-pro. give your answer to 3 decimal places. if you do not have your calculator, you can use the command =binom. dist(x, n,p, cumulative=0).

Answers: 1


Another question on Mathematics
Mathematics, 21.06.2019 21:30
Name and describe the three most important measures of central tendency. choose the correct answer below. a. the mean, sample size, and mode are the most important measures of central tendency. the mean of a data set is the sum of the observations divided by the middle value in its ordered list. the sample size of a data set is the number of observations. the mode of a data set is its highest value in its ordered list. b. the sample size, median, and mode are the most important measures of central tendency. the sample size of a data set is the difference between the highest value and lowest value in its ordered list. the median of a data set is its most frequently occurring value. the mode of a data set is sum of the observations divided by the number of observations. c. the mean, median, and mode are the most important measures of central tendency. the mean of a data set is the product of the observations divided by the number of observations. the median of a data set is the lowest value in its ordered list. the mode of a data set is its least frequently occurring value. d. the mean, median, and mode are the most important measures of central tendency. the mean of a data set is its arithmetic average. the median of a data set is the middle value in its ordered list. the mode of a data set is its most frequently occurring value.
Answers: 3
Mathematics, 22.06.2019 01:10
Given: ae ≅ ce ; de ≅ be prove: abcd is a parallelogram. we have that ab || dc. by a similar argument used to prove that △aeb ≅ △ced, we can show that △ ≅ △ceb by. so, ∠cad ≅ ∠ by cpctc. therefore, ad || bc by the converse of the theorem. since both pair of opposite sides are parallel, quadrilateral abcd is a parallelogram.
Answers: 3
Mathematics, 22.06.2019 01:20
1. why is a frequency distribution useful? it allows researchers to see the "shape" of the data. it tells researchers how often the mean occurs in a set of data. it can visually identify the mean. it ignores outliers. 2. the is defined by its mean and standard deviation alone. normal distribution frequency distribution median distribution marginal distribution 3. approximately % of the data in a given sample falls within three standard deviations of the mean if it is normally distributed. 95 68 34 99 4. a data set is said to be if the mean of the data is greater than the median of the data. normally distributed frequency distributed right-skewed left-skewed
Answers: 2
You know the right answer?
Approximately 10% of people are left-handed. if 15 people are selected at random, what is the probab...
Questions

Arts, 26.12.2020 22:30

Mathematics, 26.12.2020 22:30
Mathematics, 26.12.2020 22:30
Mathematics, 26.12.2020 22:30

Mathematics, 26.12.2020 22:30

Chemistry, 26.12.2020 22:30
Mathematics, 26.12.2020 22:30


Health, 26.12.2020 22:40


