
Mathematics, 10.10.2019 22:30 mom2acjm
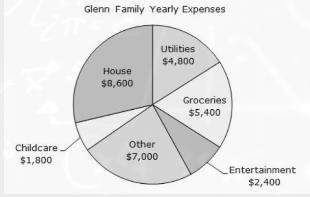
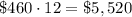
The yearly expenses for the glenn family are represented in the circle graph. the glenn’s have just purchased a new car. a new category must be added to the circle graph to represent the car costs. the payments for the new car will be $375.00 per month and the insurance for the new car will be $85.00 per month. the new car expenses will need to be taken from the other category because total yearly expenses must remain the same. which of the following would represent the approximate percentages for the car and other categories needed to create a new circle graph representation of the glenn family yearly expenses? car: 1.53% other: 21.8%
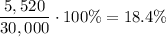
car: 15% other: 8.3%
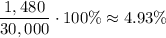
car: 18.4% other: 4.9%
car: 15.5% other: 19.7%

Answers: 3


Another question on Mathematics
Mathematics, 21.06.2019 14:30
The sum of two numbers is 58. the first number is 8 less than half the second number. let c represent the first number. let drepresent the second number. which statements about solving for the two numbers are true? check all that apply.the equation  represents the sum of the two numbers.the equation  represents the sentence “the first number is 8 less than half the second number.”the equation  represents the relationship between the two numbers.the equation  represents the sum of the two numbers.the number d is 14.the number c is 44.the number c is 14.the number d is 44.
Answers: 1
Mathematics, 21.06.2019 17:00
Joseph haydn pet store offers wide variety of leashes for dogs. the store purchases one popular type of leash from its manufacturer for $4.38 each. joseph haydn pets marks up leashes at a rate of 238% of cost. what is the retail price of the popular leash?
Answers: 1
Mathematics, 21.06.2019 20:30
3.17 scores on stats final. below are final exam scores of 20 introductory statistics students. 1 2 3 4 5 6 7 8 9 10 11 12 13 14 15 16 17 18 19 20 57, 66, 69, 71, 72, 73, 74, 77, 78, 78, 79, 79, 81, 81, 82, 83, 83, 88, 89, 94 (a) the mean score is 77.7 points. with a standard deviation of 8.44 points. use this information to determine if the scores approximately follow the 68-95-99.7% rule. (b) do these data appear to follow a normal distribution? explain your reasoning using the graphs provided below.
Answers: 1
You know the right answer?
The yearly expenses for the glenn family are represented in the circle graph. the glenn’s have just...
Questions


Health, 28.06.2021 14:50
Mathematics, 28.06.2021 14:50

World Languages, 28.06.2021 14:50

Arts, 28.06.2021 15:00
Mathematics, 28.06.2021 15:00

Chemistry, 28.06.2021 15:00
Mathematics, 28.06.2021 15:00
Mathematics, 28.06.2021 15:00
Mathematics, 28.06.2021 15:00
English, 28.06.2021 15:10


