
Mathematics, 14.10.2019 16:10 BriTheKueen
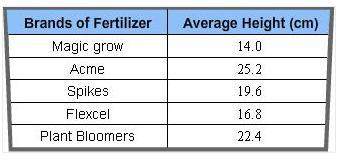
This chart shows the result of an experiment conducted to see the effect of different brands of fertilizers on the growth of a bean plant.
which of the following ranges would be appropriate to use in order to represent the numerical data in centimeters on the vertical axis of a line graph?
a. 0.0 to 26.0
b. 0.0 to 25.0
c. 14.0 to 25.2**
d. 0.0 to 20.0

Answers: 1


Another question on Mathematics
Mathematics, 21.06.2019 14:00
Which expression is equivalent to? assume x > 0 and y > 0.
Answers: 1
Mathematics, 21.06.2019 15:00
Two lines parallel to a third line are parallel to each other. always sometimes or never
Answers: 1
Mathematics, 21.06.2019 15:00
Brady has a 20 year fixed rate mortgage for $215,500 with monthly payments of 1,305.89.the annual interest rate is 4%. what is the total cost of the principal and interest for this loan rounded to the nearest dollar
Answers: 3
Mathematics, 21.06.2019 18:00
Ammonia molecules have three hydrogen atoms and one nitrogen atom.how many of each atom arein five molecules of ammonia
Answers: 1
You know the right answer?
This chart shows the result of an experiment conducted to see the effect of different brands of fert...
Questions

Social Studies, 07.01.2020 05:31


Social Studies, 07.01.2020 05:31
Social Studies, 07.01.2020 05:31


