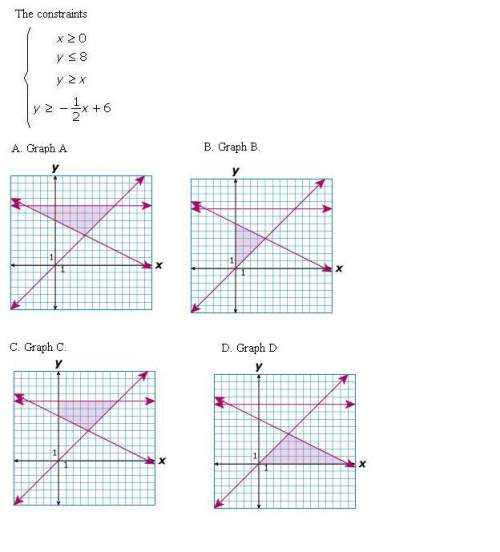
which graph best represents the feasibility region for the system shown below?

Mathematics, 14.10.2019 22:20 KingSavage5206
Need
which graph best represents the feasibility region for the system shown below?
i cant decide whether the answer is b or c.

Answers: 2


Another question on Mathematics
Mathematics, 20.06.2019 18:04
You can model the population of a certain city between 1955-2000 by the radical function p(x)=55,000 sqrt x-1945. using this model, in which year was the population of that city 220,000
Answers: 1
Mathematics, 21.06.2019 16:30
The label on the car's antifreeze container claims to protect the car between ? 40°c and 125°c. to convert celsius temperature to fahrenheit temperature, the formula is c = 5 over 9 (f ? 32). write and solve the inequality to determine the fahrenheit temperature range at which this antifreeze protects the car. ? 40 > 5 over 9 (f ? 32) > 125; ? 40 > f > 257 ? 40 < 5 over 9 (f ? 32) < 125; ? 40 < f < 257 ? 40 < 5 over 9 (f ? 32); ? 40 < f 5 over 9 (f ? 32) < 125; f < 257
Answers: 2
Mathematics, 21.06.2019 21:20
Christine wong has asked dave and mike to her move into a new apartment on sunday morning. she has asked them both, in case one of them does not show up. from past experience, christine knows that there is a 40% chance that dave will not show up and a 30% chance that mik a. what is the probability that both dave and mike will show up? (round your answer to 2 decimal places.) b. what is the probability that at least one of them will show up? c. what is the probability that neither dave nor mike will show up? (round your answer to 2 decimal places.)e will not show up. dave and mike do not know each other and their decisions can be assumed to be independent.
Answers: 2
Mathematics, 21.06.2019 22:30
The ivring berlin learning center would like a possible net profit of $650,000 on its new resource manual it sells to schools. the fixed costs for producing the manual are $780,000 and the variable cost per package is $19.85. if the estimated unit sales are 1,250,000 units, what selling price unit should the ivring berlin learning center try?
Answers: 1
You know the right answer?
Need
which graph best represents the feasibility region for the system shown below?
which graph best represents the feasibility region for the system shown below?
Questions


Mathematics, 26.10.2019 07:43

History, 26.10.2019 07:43
Mathematics, 26.10.2019 07:43

English, 26.10.2019 07:43
Mathematics, 26.10.2019 07:43

Biology, 26.10.2019 07:43

Social Studies, 26.10.2019 07:43

Physics, 26.10.2019 07:43
Mathematics, 26.10.2019 07:43
Mathematics, 26.10.2019 07:43
English, 26.10.2019 07:43

Arts, 26.10.2019 07:43


