Comparing relationships with tables
1. decide whether each table could represent a proportiona...

Mathematics, 16.10.2019 01:10 ogzayy
Comparing relationships with tables
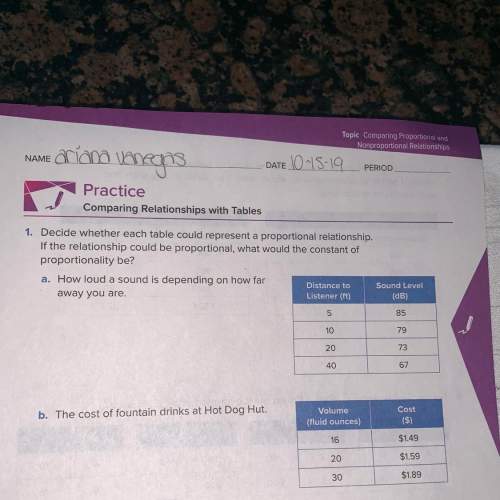
1. decide whether each table could represent a proportional relationship.
if the relationship could be proportional, what would the constant of
proportionality be?
a. how loud a sound is depending on how far
distance to
away you are.
listener (ft)
sound level
(db)
85
79
10
20
40
73
67
cost
b. the cost of fountain drinks at hot dog hut.
volume
(fluid ounces)
($)
$1.49
20
$1.59
$1.89
30

Answers: 2


Another question on Mathematics
Mathematics, 21.06.2019 23:00
The equation shown below represents function f. f(x)= -2x+5 the graph shown below represents function g. which of the following statements is true? a. over the interval [2, 4], the average rate of change of f is the same as the average rate of change of g. the y-intercept of function f is less than the y-intercept of function g. b. over the interval [2, 4], the average rate of change of f is greater than the average rate of change of g. the y-intercept of function f is greater than the y-intercept of function g. c. over the interval [2, 4], the average rate of change of f is the same as the average rate of change of g. the y-intercept of function f is greater than the y-intercept of function g. d. over the interval [2, 4], the average rate of change of f is less than the average rate of change of g. the y-intercept of function f is the same as the y-intercept of function g.
Answers: 1
Mathematics, 21.06.2019 23:20
Which shows a reasonable estimation for 124% of 42 using the distributive property?
Answers: 1
Mathematics, 21.06.2019 23:30
In a study of the relationship between socio-economic class and unethical behavior, 129 university of california undergraduates at berkeley were asked to identify themselves as having low or high social-class by comparing themselves to others with the most (least) money, most (least) education, and most (least) respected jobs. they were also presented with a jar of individually wrapped candies and informed that the candies were for children in a nearby laboratory, but that they could take some if they wanted. after completing some unrelated tasks, participants reported the number of candies they had taken. it was found that those who were identiď¬ed as upper-class took more candy than others. in this study, identify: (a) the cases, (b) the variables and their types, (c) the main research question, (d) identify the population of interest and the sample in this study, and (e) comment on whether or not the results of the study can be generalized to the population, and if the ď¬ndings of the study can be used to establish causal relationships.
Answers: 2
You know the right answer?
Questions

Mathematics, 12.04.2021 21:40

Chemistry, 12.04.2021 21:40


Arts, 12.04.2021 21:40
Mathematics, 12.04.2021 21:40


Spanish, 12.04.2021 21:40
Mathematics, 12.04.2021 21:40
History, 12.04.2021 21:40


