
Mathematics, 18.10.2019 23:30 yasmin599
The airline passenger association studied the relationship between the number of passengers on a particular flight and the cost of the flight. it seems logical that more passengers on the flight will result in more weight and more luggage, which in turn will result in higher fuel costs. for a sample of 9 flights, the correlation between the number of passengers and total fuel cost was 0.734.
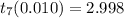
1. state the decision rule for 0.010 significance level: h0: rho ≤ 0; h1: rho > 0 (round your answer to 3 decimal places.) reject h0 if t >
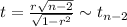
2. compute the value of the test statistic. (round your answer to 3 decimal places.) value of the test statistic
3. can we conclude that the correlation in the population is greater than zero? use the 0.010 significance level (click to select)rejectdo not reject h0 . it is (click to select)not reasonablereasonable to conclude that there is positive association in the population between the two variables.

Answers: 1


 , hence we accept hypothesis or H_o

Another question on Mathematics
Mathematics, 21.06.2019 19:00
Point r divides in the ratio 1 : 3. if the x-coordinate of r is -1 and the x-coordinate of p is -3, what is the x-coordinate of q? a. b. 3 c. 5 d. 6 e. -9
Answers: 1
Mathematics, 22.06.2019 00:00
Plz answer asap! i will reward brainliest and 12 points for these three questions!take notice: these three questions are completely different! 1) what is the percentage of sugar in the syrup made of 10 kg of water and 4 kg of suugar? 2) what was the original price if after 10% discount it became $450? 3) at first a price was decreased by 12%, then it was disounted again by an additional 5%. what is the percent of the total discount? , and remeber i will award brainliest and 12 points!
Answers: 1
Mathematics, 22.06.2019 01:00
Use mathematical induction to prove the statement is true for all positive integers n, or show why it is false. 1^2 + 4^2 + 7^2 + + (3n - 2)^2 = [n(6n^2-3n-1)/2]
Answers: 1
Mathematics, 22.06.2019 01:30
In 2000, for a certain region, 27.1% of incoming college freshman characterized their political views as liberal, 23.1% as moderate, and 49.8% as conservative. for this year, a random sample of 400 incoming college freshman yielded the frequency distribution for political views shown below. a. determine the mode of the data. b. decide whether it would be appropriate to use either the mean or the median as a measure of center. explain your answer. political view frequency liberal 118 moderate 98 conservative 184 a. choose the correct answer below. select all that apply. a. the mode is moderate. b. the mode is liberal. c. the mode is conservative. d. there is no mode.
Answers: 1
You know the right answer?
The airline passenger association studied the relationship between the number of passengers on a par...
Questions

English, 26.10.2020 22:50

History, 26.10.2020 22:50
Mathematics, 26.10.2020 22:50
Mathematics, 26.10.2020 22:50


Social Studies, 26.10.2020 22:50

Social Studies, 26.10.2020 22:50
Health, 26.10.2020 22:50
Mathematics, 26.10.2020 22:50

Computers and Technology, 26.10.2020 22:50
English, 26.10.2020 22:50


