Which inequality is shown in the graph?
a. y=x^2 - 5
b. y _> x^2 +5
с. y _>...

Mathematics, 20.10.2019 02:10 jaylinzavala
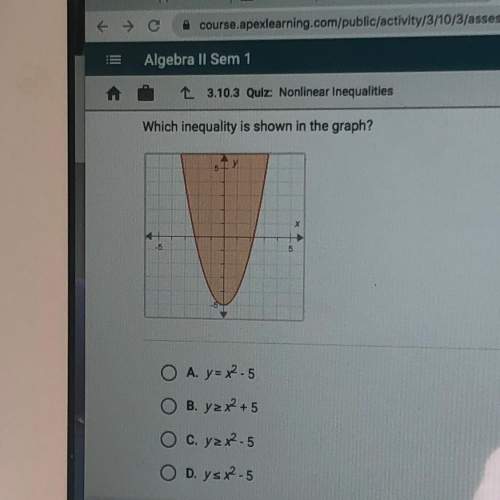
Which inequality is shown in the graph?
a. y=x^2 - 5
b. y _> x^2 +5
с. y _> x^2 - 5
d. y_< x^2 -5

Answers: 1


Another question on Mathematics
Mathematics, 21.06.2019 15:50
(08.01)consider the following pair of equations: x + y = −2 y = 2x + 10 if the two equations are graphed, at what point do the lines representing the two equations intersect? (−4, 2) (4, 2) (−2, 4) (2, 4)
Answers: 2
Mathematics, 21.06.2019 18:30
In the following diagram it is given that dec,ab || dc, ad || eb, and ad is congruent to bc. a)why isn't abc a parallelogram even though it has a pair of parallel sides and a pair of congruent sides b)explain why be must be congruent to bc. further explain what type of triangle this makes triangle abc and what it tells you about angle 1 and angle 2c) finally why must angle 3 be congruent to angle 1? further, explain why we know that angle 3 is congruent to angle 2
Answers: 1
Mathematics, 21.06.2019 19:00
The quadratic function h(t)=-16.1t^2+150 choose the graph representation
Answers: 1
Mathematics, 21.06.2019 19:20
Brainliest ! which of the coordinates are not of th vertices of the feasible region for the system of inequalities y≤4,,x≤5,x+y> 6 a(2,4) b(0,6) c(5,4) d(5,1)
Answers: 2
You know the right answer?
Questions


Computers and Technology, 18.03.2021 03:10


Social Studies, 18.03.2021 03:10
History, 18.03.2021 03:10

Mathematics, 18.03.2021 03:10
Mathematics, 18.03.2021 03:10
Mathematics, 18.03.2021 03:10
Mathematics, 18.03.2021 03:10
Biology, 18.03.2021 03:10
Mathematics, 18.03.2021 03:10

Health, 18.03.2021 03:10


