1. a silly psychology student gathers data on the shoe size of 30 of his classmates and their
...

Mathematics, 22.10.2019 07:00 paulawells11
1. a silly psychology student gathers data on the shoe size of 30 of his classmates and their
gpa's. the correlation coefficient between these two variables is most likely to be
a) exactly -1.0 b) near -0.6 c) near 0 d) near +0.6 e) exactly +1.0

Answers: 3


Another question on Mathematics
Mathematics, 21.06.2019 13:30
Describe the possible echelon forms of the standard matrix for a linear transformation t where t: set of real numbers is onto.
Answers: 2
Mathematics, 21.06.2019 23:00
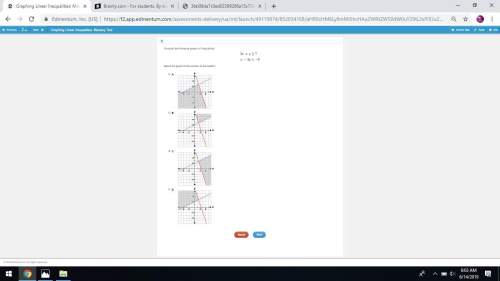
Complete the conditional statement. if a + 2 < b + 3, then a < b b < a a – b < 1 a < b + 1
Answers: 3
Mathematics, 22.06.2019 01:30
In 2000, for a certain region, 27.1% of incoming college freshman characterized their political views as liberal, 23.1% as moderate, and 49.8% as conservative. for this year, a random sample of 400 incoming college freshman yielded the frequency distribution for political views shown below. a. determine the mode of the data. b. decide whether it would be appropriate to use either the mean or the median as a measure of center. explain your answer. political view frequency liberal 118 moderate 98 conservative 184 a. choose the correct answer below. select all that apply. a. the mode is moderate. b. the mode is liberal. c. the mode is conservative. d. there is no mode.
Answers: 1
You know the right answer?
Questions

Social Studies, 21.07.2019 17:00


Geography, 21.07.2019 17:00

Biology, 21.07.2019 17:00

Physics, 21.07.2019 17:00
Mathematics, 21.07.2019 17:00

History, 21.07.2019 17:00

Advanced Placement (AP), 21.07.2019 17:00
Social Studies, 21.07.2019 17:00


