
Mathematics, 23.10.2019 22:00 Isactuallycarter99
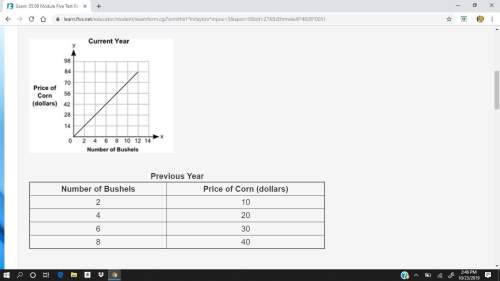
The graph shows the prices of different numbers of bushels of corn at a store in the current year. the table shows the prices of different numbers of bushels of corn at the same store in the previous year.
a graph shows number of bushels on x-axis and price of corn in dollars on y-axis. the x-axis scale is shown from 0 to 14 at increments of 2, and the y-axis scale is shown from 0 to 98 at increments of 14. a straight line joins the ordered pairs 2, 14 and 4, 28 and 6, 42 and 8, 56 and 10, 70 and 12, 84.
previous year
number of bushels
price of corn (dollars)
2
10
4
20
6
30
8
40
part a: describe in words how you can find the rate of change of a bushel of corn in the current year, and find the value. (5 points)
part b: how many dollars more is the price of a bushel of corn in the current year than the price of a bushel of corn in the previous year? show your work. (5 points)

Answers: 1


Another question on Mathematics
Mathematics, 21.06.2019 18:00
State if the two triangles are congruent. if they are, state how you know?
Answers: 1
Mathematics, 21.06.2019 18:20
Find the solution of this system of equation -7x+y=-20 9x-3y=36
Answers: 1
Mathematics, 21.06.2019 18:30
If you have the following equation, 2/3x+5/6-x=2-3/4x what would you multiply each term by to get rid of all the fractions
Answers: 3
You know the right answer?
The graph shows the prices of different numbers of bushels of corn at a store in the current year. t...
Questions

History, 05.12.2020 21:30
History, 05.12.2020 21:30

Social Studies, 05.12.2020 21:30
History, 05.12.2020 21:30
Mathematics, 05.12.2020 21:30

Biology, 05.12.2020 21:30

Chemistry, 05.12.2020 21:30
History, 05.12.2020 21:30
Mathematics, 05.12.2020 21:30
Mathematics, 05.12.2020 21:30
Biology, 05.12.2020 21:30
Chemistry, 05.12.2020 21:30

English, 05.12.2020 21:30


