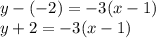
The third equation: 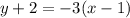
Step-by-step explanation:
The two points on the line are  and
and  .
.
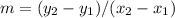
Slope of the line passing through two points  and
and  is given as:
Here, and are and .
Therefore, slope is equal to, 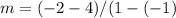


Now, equation of a straight line with slope m and points and is given as:
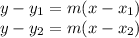
Now, if we use the 2nd form, then 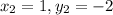 .
.
So, the equation is given as :