
Mathematics, 30.10.2019 18:31 nady82
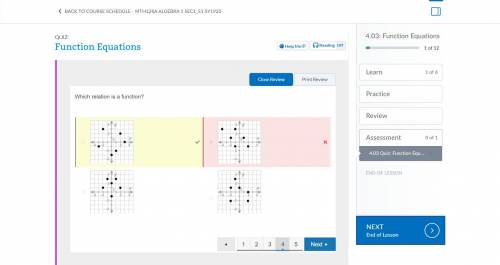
Answer ! which relation is a function? number graph ranging from negative four to four on the x and y axes. points are drawn on the graph at begin ordered pair negative three comma negative one end ordered pair and begin ordered pair negative two comma three end ordered pair and begin ordered pair zero comma negative three end ordered pair and begin ordered pair one comma negative two end ordered pair and begin ordered pair two comma two end ordered pair and begin ordered pair three comma zero end ordered pair number graph ranging from negative four to four on the x and y axes. points are drawn on the graph at begin ordered pair negative two comma one end ordered pair and begin ordered pair negative one comma three end ordered pair and begin ordered pair zero comma two end ordered pair and begin ordered pair zero comma negative one end ordered pair and begin ordered pair one comma three end ordered pair and begin ordered pair two comma one end ordered pair number graph ranging from negative four to four on the x and y axes. points are drawn on the graph at begin ordered pair negative two comma one end ordered pair and begin ordered pair negative two comma negative two end ordered pair and begin ordered pair negative one comma three end ordered pair and begin ordered pair zero comma one end ordered pair and begin ordered pair two comma zero end ordered pair and begin ordered pair two comma negative two end ordered pair number graph ranging from negative four to four on the x and y axes. points are drawn on the graph at begin ordered pair negative four comma three end ordered pair and begin ordered pair negative two comma one end ordered pair and begin ordered pair negative one comma three end ordered pair and begin ordered pair negative one comma negative one end ordered pair and begin ordered pair one comma one end ordered pair and begin ordered pair two comma negative one end ordered pair

Answers: 2


Another question on Mathematics
Mathematics, 21.06.2019 18:00
Last year, a state university received 3,560 applications from boys. of those applications, 35 percent were from boys who lived in other states. part a)how many applications did the university receive from boys who lived in other states? part b)applications to the university from boys represented 40percent of all applications. how many applications did the university receive in all? i don't how to do part b so me and plz tell how you got your answer
Answers: 1
Mathematics, 21.06.2019 21:30
Questions 7-8. use the following table to answer. year 2006 2007 2008 2009 2010 2011 2012 2013 cpi 201.6 207.342 215.303 214.537 218.056 224.939 229.594 232.957 7. suppose you bought a house in 2006 for $120,000. use the table above to calculate the 2013 value adjusted for inflation. (round to the nearest whole number) 8. suppose you bought a house in 2013 for $90,000. use the table above to calculate the 2006 value adjusted for inflation. (round to the nearest whole number)
Answers: 3
Mathematics, 21.06.2019 23:10
Consider the following function. which of the following graphs corresponds to the given function? w. x. y. z. a. z b. y c. x d.
Answers: 1
You know the right answer?
Answer ! which relation is a function? number graph ranging from negative four to four on the x an...
Questions
Mathematics, 03.12.2019 11:31


Arts, 03.12.2019 11:31

Computers and Technology, 03.12.2019 11:31

History, 03.12.2019 11:31
Mathematics, 03.12.2019 11:31


Physics, 03.12.2019 11:31

Mathematics, 03.12.2019 11:31
Physics, 03.12.2019 11:31


