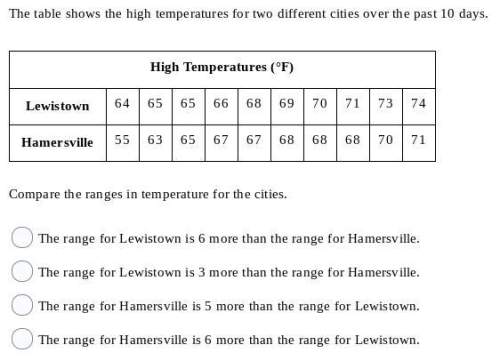
The table shows the high temperatures for two different cities over the past 10 days.
in...

Mathematics, 05.11.2019 02:31 raewalker23p4ibhy
The table shows the high temperatures for two different cities over the past 10 days.
includes options, guys!

Answers: 1


Another question on Mathematics
Mathematics, 21.06.2019 21:30
Vanessa earns a base salary of $400.00 every week with an additional5% commission on everything she sells. vanessa sold $1650.00 worth of items last week.
Answers: 2
Mathematics, 22.06.2019 02:00
1. the manager of collins import autos believes the number of cars sold in a day (q) depends on two factors: (1) the number of hours the dealership is open (h) and (2) the number of salespersons working that day (s). after collecting data for two months (53 days), the manager estimates the following log-linear model: q 4 equation 1 a. explain, how to transform the log-linear model into linear form that can be estimated using multiple regression analysis. the computer output for the multiple regression analysis is shown below: q4 table b. how do you interpret coefficients b and c? if the dealership increases the number of salespersons by 20%, what will be the percentage increase in daily sales? c. test the overall model for statistical significance at the 5% significance level. d. what percent of the total variation in daily auto sales is explained by this equation? what could you suggest to increase this percentage? e. test the intercept for statistical significance at the 5% level of significance. if h and s both equal 0, are sales expected to be 0? explain why or why not? f. test the estimated coefficient b for statistical significance. if the dealership decreases its hours of operation by 10%, what is the expected impact on daily sales?
Answers: 2
Mathematics, 22.06.2019 02:30
Which statement best explains whether the table represents a linear or nonlinear function? input (x) output (y) 2 5 4 10 6 15 8 20 it is a linear function because the input values are increasing. it is a nonlinear function because the output values are increasing. it is a linear function because there is a constant rate of change in both the input and output. it is a nonlinear function because there is a constant rate of change in both the input and output.
Answers: 3
Mathematics, 22.06.2019 04:10
Find the tenth term in the following geometric sequence. 8, 4, 2, 1, . .a) 13b) 0.0078c) 0.0156d) 12.5
Answers: 2
You know the right answer?
Questions

History, 24.11.2019 23:31

Social Studies, 24.11.2019 23:31
History, 24.11.2019 23:31

English, 24.11.2019 23:31
Mathematics, 24.11.2019 23:31
English, 24.11.2019 23:31
Mathematics, 24.11.2019 23:31
Mathematics, 24.11.2019 23:31
Mathematics, 24.11.2019 23:31
Mathematics, 24.11.2019 23:31
History, 24.11.2019 23:31

Mathematics, 24.11.2019 23:31


