
![[0, 3],](/tpl/images/0359/9960/32614.png) you do
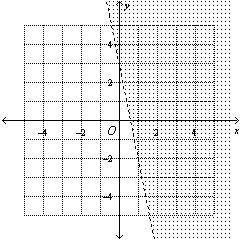
you do  by either moving five blocks north over one block west or five blocks south over one block east [west and south are negatives], then you shade everything to the right of the line because using the zero-interval test, also known as the test point [origin], we can determine what side of a line to shade. This is done by plugging "0" in for both y and x, then determining whether false or true will tell you which side to shade. In this case, we shade to the right of the line because when we plug the test point into the function, we get this false statement:
Choose the linear inequality that describes each graph.
y > – 5x + 3
y &...

Mathematics, 05.11.2019 04:31 19zmurphy
Choose the linear inequality that describes each graph.
y > – 5x + 3
y > – 5x – 3
y < – 5x + 3
y > – 3x + 5

Answers: 3


Another question on Mathematics
Mathematics, 21.06.2019 15:00
Martha needs 22.25 strawberries for every 5 smoothies she makes. complete the table to see how many strawberries she would need to make 10 smoothies and 20 smoothies.
Answers: 1
Mathematics, 21.06.2019 16:00
The equation x2 – 1x – 90 = 0 has solutions {a, b}. what is a + b?
Answers: 1
Mathematics, 21.06.2019 19:00
In a class, there are 12 girls. if the ratio of boys to girls is 5: 4 how many boys are there in the class
Answers: 1
Mathematics, 21.06.2019 22:00
In dire need~! describe how to use area models to find the quotient 2/3 divided by 1/5. check your work by also finding the quotient 2/3 divided by 1/5 using numerical operations only.
Answers: 1
You know the right answer?
Questions

Chemistry, 27.08.2021 07:40
Mathematics, 27.08.2021 07:40
Mathematics, 27.08.2021 07:40
Mathematics, 27.08.2021 07:40
Mathematics, 27.08.2021 07:40

English, 27.08.2021 07:40
Mathematics, 27.08.2021 07:40

Mathematics, 27.08.2021 07:40
Mathematics, 27.08.2021 07:40

History, 27.08.2021 07:40
Mathematics, 27.08.2021 07:40
Mathematics, 27.08.2021 07:40

Mathematics, 27.08.2021 07:40


