
Mathematics, 06.11.2019 20:31 Tanya120
I'm in need of ! i have another previous question to this, this is simply part 3. i have my work attached with the charts i've made.
question:
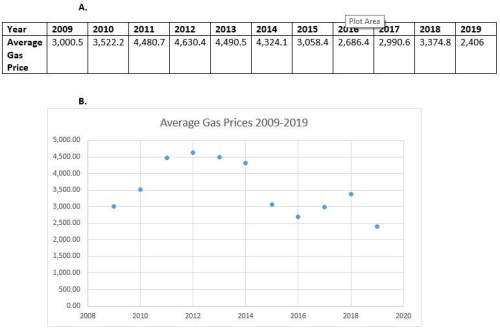
c. what equation models the data? what are the domain and range of the equation? do you think your equation is a good fit for the data? explain how you determined your answers.
d. is there a trend in the data? does there seem to be a positive correlation, a negative correlation, or neither?
how much do you expect gas to cost in 2020? explain.
my answers so far;
c. an equation that models the graph might be; x×m=y
x=price
m=gallon
y=total price
the domain and the range of the equation would be . i believe my equation is a good fit for the model because it is the 2 main forms of data to be multiplied to come with the proper outcome.
d. there is a mild trend in the data. it ranges between 2,500 – 4,500.

Answers: 1


Another question on Mathematics
Mathematics, 21.06.2019 21:30
Suppose y varies directly with x. write a direct variation equation that relates x and y. then find the value of y when x=12 y=7 when x=3
Answers: 1
Mathematics, 22.06.2019 02:00
The line plot below represents the number of letters written to overseas pen pals by the students at the waverly middle school.each x represents 10 students. how many students wrote more than 6 and fewer than 20 letters. a.250 b.240 c.230 d.220
Answers: 3
Mathematics, 22.06.2019 02:30
Solve for x -3+3b> 9a: ) x> 4b-9/3b: ) x< 9-4b/3c: ) x< -4b+9/-3d: ) x> 4b+9/-3
Answers: 1
Mathematics, 22.06.2019 04:10
You are in charge of the customer service phone line with many employees. at the end of each phone callthe customers are asked to rate their service from 1 to 5 stars, with 5 being the best. you find the averagerating for 20 randomly selected employees and decide you want to improve the ratings so you require thoseemployees to go through a new training program. you then wait a week and find the new average rating foreach employee. the average change is an increase in 1.3 stars with a standard devation of .9 stars.(a) is this data paired or not paired? (b) what are the null and alternative hypothesis being tested? (c) what is the t-statistic you would use? write the general formula and the final calculation.(d) sketch a t-distribution, label your t-statistic and the probability you would be interested in:
Answers: 2
You know the right answer?
I'm in need of ! i have another previous question to this, this is simply part 3. i have my work at...
Questions

Physics, 12.01.2020 16:31

History, 12.01.2020 16:31


Advanced Placement (AP), 12.01.2020 16:31

Mathematics, 12.01.2020 16:31
Mathematics, 12.01.2020 16:31
Biology, 12.01.2020 16:31
Biology, 12.01.2020 16:31

Chemistry, 12.01.2020 16:31
Mathematics, 12.01.2020 16:31
Mathematics, 12.01.2020 16:31


