
The following table describes a randomized trial comparing an
experimental medication to a pla...

Mathematics, 07.11.2019 18:31 terrieldixon
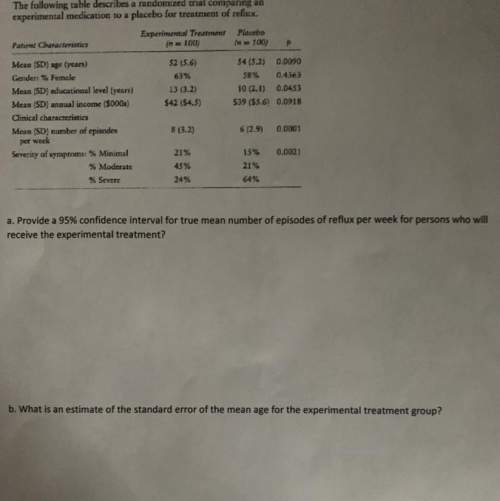
The following table describes a randomized trial comparing an
experimental medication to a placebo for treatment of reflux.
experimental treatment
(1 = 100)
placebo
(n = 100)
p
patient characteristics
52 (5.6)
63%
13 (3.2)
$42 (s4.5)
54 (5.2) 0.0090
58% 0.4563
10 (2.1) 0.0453
539 ($5.6) 0.0918
mcan (sd) age (years)
gender: % female
mean (sd) educational level (years)
mean (sd) annual income ($000s)
clinical characteristics
mean (sd) number of episodes
per week
severity of symptoms: % minimal
% moderate
% severe
8 (3.2)
6 (2.9)
0.0001
0.0021
21%
45%
15%
21%
64%
24%
a. provide a 95% confidence interval for true mean number of episodes of reflux per week for persons who will
receive the experimental treatment?
b. what is an estimate of the standard error of the mean age for the experimental treatment group?
c. what is an estimate of the standard error for the sample proportion of females in the experimental treatment
group?

Answers: 1


Another question on Mathematics
Mathematics, 20.06.2019 18:04
What number must you add to complete the square x^2+12x=16
Answers: 1
Mathematics, 21.06.2019 20:30
Which equation expression the relationship between the number of boxes b and the number of cans c and the proportion is 48
Answers: 1
Mathematics, 21.06.2019 22:20
Select the correct answer from each drop-down menu. the table shows the annual sales revenue for different types of automobiles from three automobile manufacturers. sales revenue (millions of dollars) suv sedan truck marginal total b & b motors 22 15 9 46 pluto cars 25 27 10 62 panther motors 26 34 12 72 marginal total 73 76 31 180 the company with the highest percentage of sales revenue from sedans is . of the annual sales revenue from suvs, the relative frequency of pluto cars is .
Answers: 1
Mathematics, 21.06.2019 23:00
The weight of a radioactive isotope was 96 grams at the start of an experiment. after one hour, the weight of the isotope was half of its initial weight. after two hours, the weight of the isotope was half of its weight the previous hour. if this pattern continues, which of the following graphs represents the weight of the radioactive isotope over time? a. graph w b. graph x c. graph y d. graph z
Answers: 2
You know the right answer?
Questions

Social Studies, 02.12.2020 17:50

English, 02.12.2020 17:50
Mathematics, 02.12.2020 17:50
Social Studies, 02.12.2020 17:50

Computers and Technology, 02.12.2020 17:50

Mathematics, 02.12.2020 17:50

Health, 02.12.2020 17:50

Business, 02.12.2020 17:50

Mathematics, 02.12.2020 17:50
Computers and Technology, 02.12.2020 17:50


